Small Business Hesitation
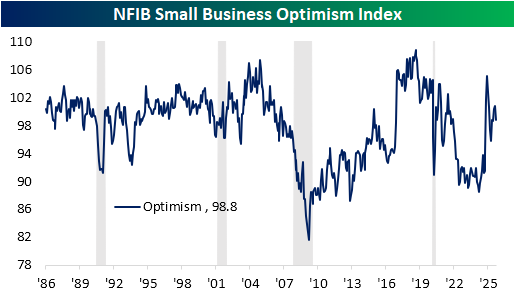
The continued US government shutdown means there remains a drought in official economic data, putting extra emphasis on unofficial data points. One such set of data is monthly small business optimism from the NFIB released this morning. The headline index dropped to 98.8 in September versus 100.8 previously in August. As we often note, including in our discussion of the report’s labor market readings in today’s Morning Lineup, the NFIB survey has historically leaned right similar to how Michigan Confidence has leaned left. Such biases mean that the data has to be taken with a grain of salt and some categories become more worthwhile in gauging economic health than others. As shown below, optimism surged in the wake of President Trump’s election last year. A similar surge was seen following the 2016 presidential election and vice versa after President Biden won in 2020. At current levels, optimism is middling versus the past decade’s range.
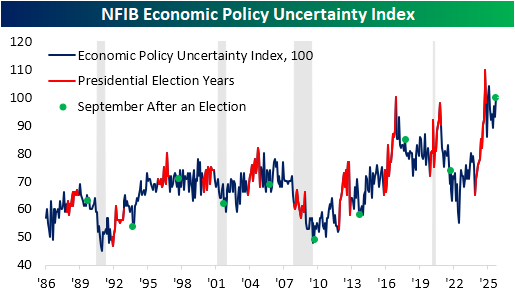
One area that is far from middling is uncertainty. Again, this is another indicator from NFIB that is a bit more sensitive to politics. Typically, the Economic Policy Uncertainty Index soars during Presidential election years and then pulls back in the following months; usually that pullback is regardless of which party came out on top. During last year’s run up to the election, this index saw a record climb, but interestingly, it has yet to reverse lower as it usually does after elections.
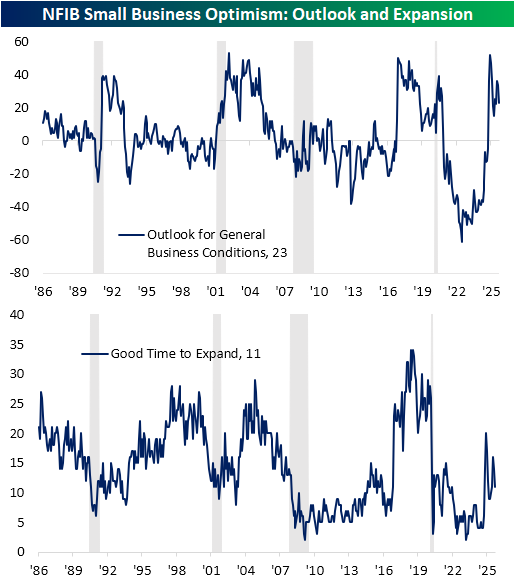
In other words, small businesses are still on edge when it comes to policy. That is putting a dampener on sentiment with fewer businesses reporting a positive outlook for the economy/general business conditions. Similarly, fewer respondents reported that they view now as a good time to expand their businesses.
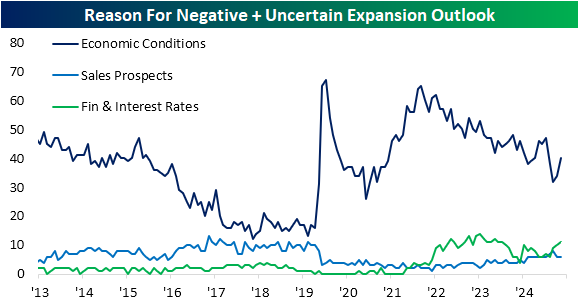
When it comes to the question of business expansion, respondents are also asked for the reasons for given outlooks. For those reporting negative and uncertain outlook, the largest share of respondents (40%) reported that it is due to economic conditions. That is up versus the multi-year low of 32% two months prior. While that reading is rebounding, it hasn’t really reversed the downtrend of the past several years. While not shown in the chart below for legibility, the next two most common reasons given were cost of expansion and political climate; each of those came in at 12% which is right in line with their respective average over the past year. Finances and interest rates were right on their heels at 11%, and this reading has the more interesting trend. The share viewing rates and finances as restrictive to expansion has steadily been climbing despite the latest rate cuts.
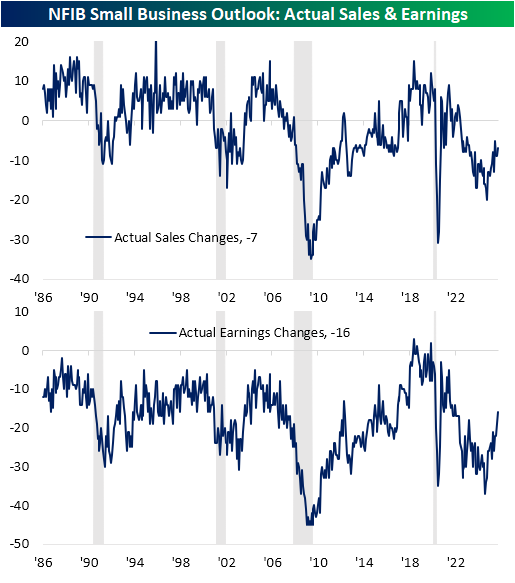
Finally, we would note that sales prospects are not a very common reason given for a negative or uncertain expansion outlook, and paired with other categories in the report, would overall suggest solid demand. As shown below, actual sales changes are negative (as has been the norm for the better part of the past 20 years) but approaching some of the strongest levels since Q1 2023. Meanwhile, actual earnings changes have rocketed higher up to the best level since December 2021.

Daily Sector Snapshot — 10/14/25
Chart of the Day – High Yield Selling Streak Ends
Bespoke’s Morning Lineup – 10/14/25 – Stuck in the Middle
See what’s driving market performance around the world in today’s Morning Lineup. Bespoke’s Morning Lineup is the best way to start your trading day. Read it now by starting a two-week trial to Bespoke Premium. CLICK HERE to learn more and start your trial.
“Pessimism never won any battle.” – Dwight Eisenhower

Below is a snippet of commentary from today’s Morning Lineup. Start a two-week trial to Bespoke Premium to view the full report.
If the market rallies on a bank holiday, does it count? Judging by the declines in US equity futures and cryptocurrency markets, it appears not. S&P 500 and Nasdaq futures point to a drop of about 1% at the open, which would erase about two-thirds of Monday’s gain. Declines in the crypto space look even scarier as Bitcoin drops 4% and Ethereum traded back down below $4,000 with a decline of nearly 7%.
The catalyst for this morning’s weakness stems from continued trade tensions with China as both countries start charging additional fees on each other’s cargo ships, and China imposed further sanctions on certain US shipping subsidiaries. The weakness also comes even after a strong batch of earnings reports on what is really the first busy day of earnings for the Q3 reporting period.
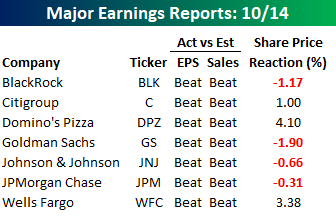
As shown in the table below, of the seven major reports this morning, all seven reported better-than-expected EPS and sales, but only three are trading higher in reaction to the reports. Domino’s (DPZ), Wells Fargo (WFC), and Citigroup (C) are all up 1% or more, while Goldman (GS) leads the declines with a drop of nearly 2%.
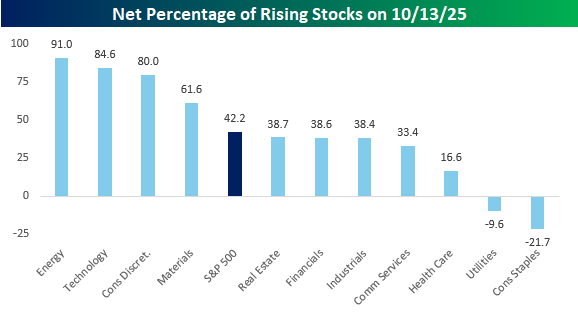
The S&P 500 had a good day to start the week yesterday, but breadth wasn’t exactly strong, especially for a day when the index rallied over 1.5%. As shown in the chart below, only four sectors saw a net of 50% or more of their components finish higher on the day. Energy and Technology led the charge with 90%+ of each sector’s components finishing higher on the day, while Consumer Discretionary (+80%) and Materials (+62%) were the only two other sectors where net breadth was stronger than the S&P 500. On the other end of the spectrum, Consumer Staples (-22%) and Utilities (-10%) both had negative net breadth, while Health Care also was relatively weak at just 17% net positive.
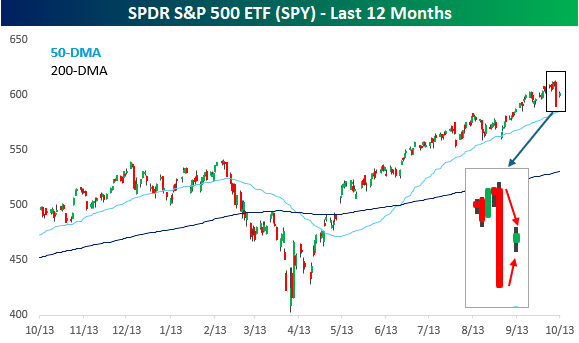
What was unique about yesterday’s trading, though, was that it was an extreme ‘inside’ day for the S&P 500 tracking ETF (SPY). An inside day in the market occurs when the intraday high for a day stalls out short of the prior session’s high, while the intraday low is higher. Not only did we have an inside day yesterday, but the intraday high was 1.3% below Friday’s high, while the intraday low was 1.1% above Friday’s low. We finished the day stuck right in the middle of the prior day’s range!
Inside days in SPY where both the intraday high and intraday low were more than 1% below or above the prior session’s extreme have been extremely rare. Since 1993, there have only been 11 other occurrences, with the most recent occurring back in April, right after the tariff-tantrum low. But before that, you have to go back to December 2020, and then before that, August 2015.
The Closer – AI Deal Flow, Consumers & Cattle, Silver Squeeze – 10/13/25
Log-in here if you’re a member with access to the Closer.
Looking for deeper insight into markets? In tonight’s Closer sent to Bespoke Institutional clients, we lead off with an overview of the interdependence of the mega-caps (page 1) followed by a check up on today’s rotation (page 2). Given a lack of official economic data, we next dive into a handful of alternative health checks on consumer spending (page 3). After that, we review food commodity prices including the new highs in beef prices (pages 4 and 5). We finish with an overview of the squeeze that has driven silver to new record highs (pages 6 and 7).
See today’s full post-market Closer and everything else Bespoke publishes by starting a 14-day trial to Bespoke Institutional today!
Daily Sector Snapshot — 10/13/25
Q3 Earnings Season Begins
The Q3 earnings season will begin in earnest tomorrow morning with four big banks and brokers set to report ahead of the open.
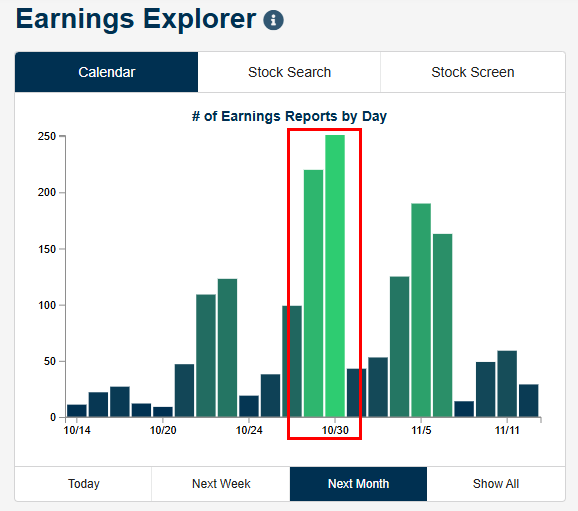
As the snapshot below from our useful Earnings Explorer tool shows, though, the peak of earnings season is still a couple of weeks away later this month. This quarter’s biggest day for earnings will be Thursday, October 30th, when roughly 250 companies will report Q3 numbers.
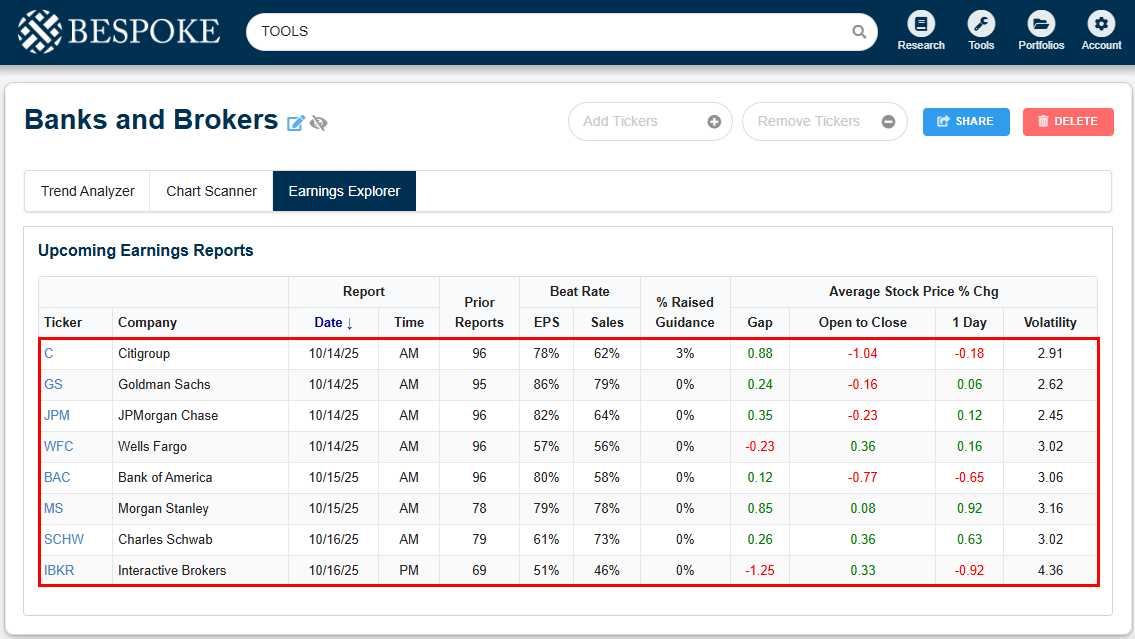
Eight big banks and brokers will report Q3 numbers in the next few days. We created a custom portfolio — just like subscribers can do — that includes each of these eight stocks so that we can take a closer look at them.
Starting with earnings, tomorrow morning we’ll hear from Citigroup (C), Goldman Sachs (GS), JP Morgan (JPM), and Wells Fargo (WFC). Of these four stocks, Goldman has the strongest “beat” rates, while Wells Fargo has the weakest. (A stock’s beat rate represents the percentage of the time it has beaten consensus analyst estimates.)
Bank of America (BAC) and Morgan Stanley (MS) will then report on Wednesday morning, while Charles Schwab (SCHW) and Interactive Brokers (IBKR) will report on Thursday.
In terms of share price reactions to earnings, Morgan Stanley (MS) is the name that has historically averaged the biggest gains on its earnings reaction days. IBKR has averaged the biggest declines and been the most volatile of the names listed.
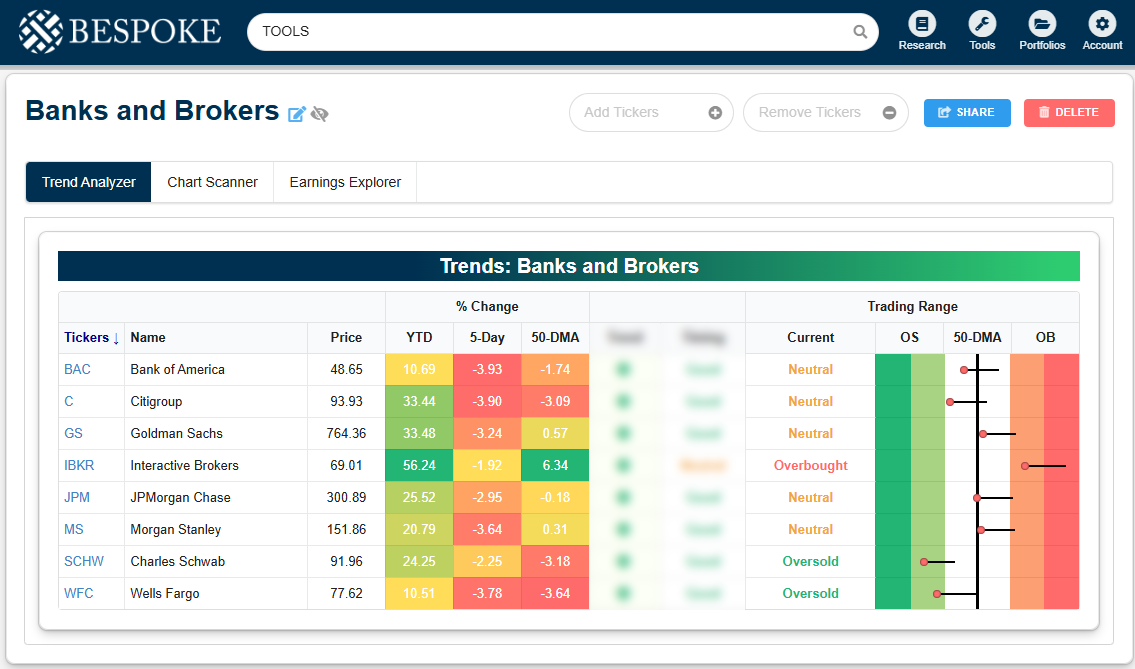
Our Custom Portfolios tool also lets you create baskets like the one below in a few simple clicks to monitor trends and trading ranges for the stocks and ETFs you care about most.
For our “Banks and Brokers” basket, you can see that all of these stocks have pulled back sharply within their ranges over the last week, following Friday’s big pullback. Heading into this week, IBKR was the only name still in “overbought” territory, while SCHW and WFC had both moved into “oversold” territory.
Regardless of recent moves, all eight of these stocks are up at least 10% year-to-date, with IBKR up the most at 56.2%, followed by Goldman and Citi with YTD gains of more than 33%.
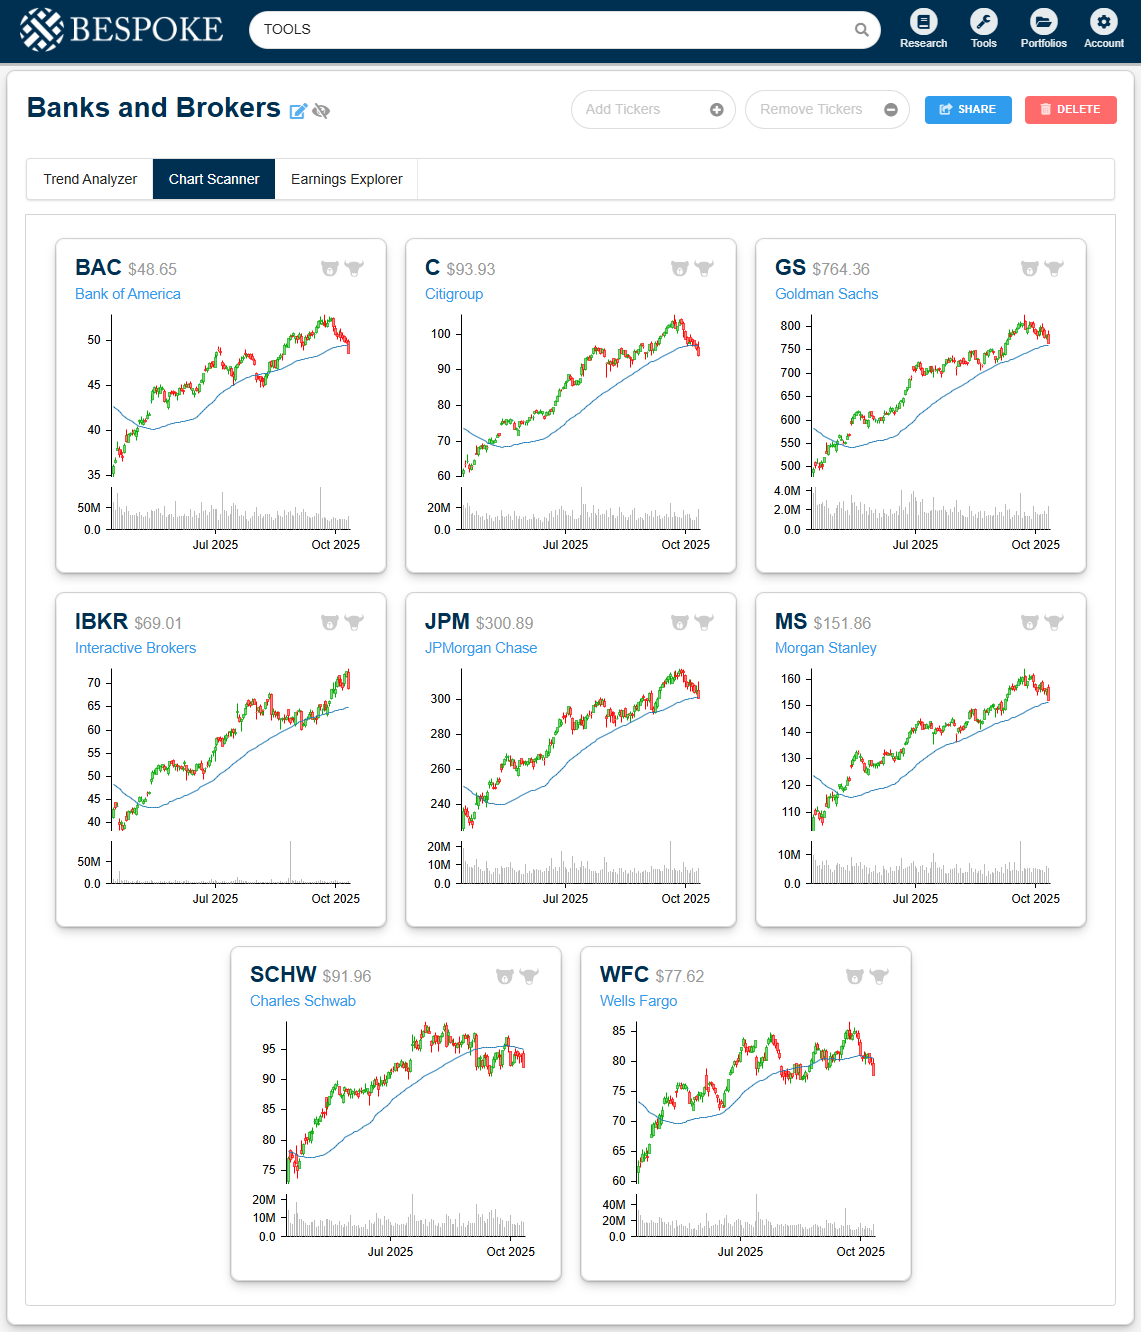
Along with the ability to easily monitor upcoming earnings reports as well as trend and timing measures, our Custom Portfolios tool lets you quickly scan price charts as well.
Below is a snapshot of six-month price charts for our Banks and Brokers basket. Notably, Goldman (GS), Morgan Stanley (MS), and Interactive Brokers (IBKR) were the only three that managed to hang on above their 50-DMAs following last Friday’s big market drop. The rest broke hard below their 50-DMAs, which puts their long-term uptrends at risk.
If you like this analysis and want to try it out with your own stocks and ETFs, simply start a Bespoke Institutional trial now and proceed to the Custom Portfolios tab. It’s super easy! Use this link to get a complimentary two-week trial plus 20% off the regular monthly rate if you choose to stick with it.

Up, Up, and Away
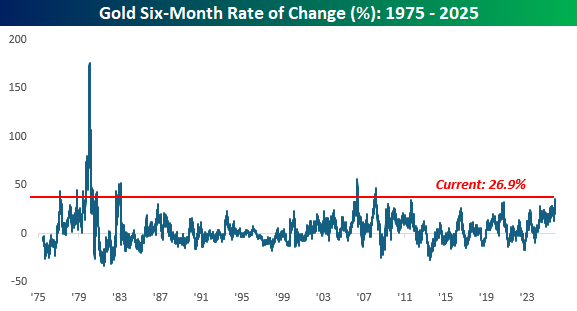
Precious metals prices have been going crazy lately. Gold’s move above $4,000/ounce last week garnered the most headlines, but its gains look pedestrian compared to other metals like silver and platinum. We’ll start with gold, though. Over the last six months, gold rallied 26.9%, and as of last week, it was up over 35% in six months. The last time it rallied that much in half a year was back in 2008.
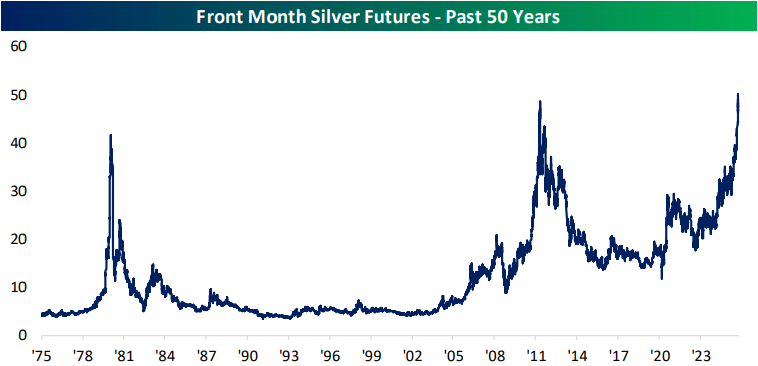
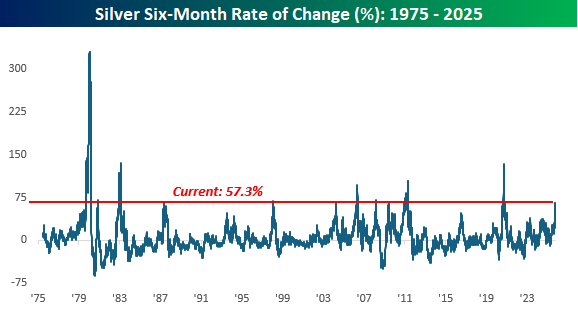
There’s nothing wrong with a gain of 26.9% in six months, but silver is still up by more than twice as much and was up over 65% in the trailing six months just last week. Historically, silver has been more volatile than gold, so its current run is ‘only’ the strongest since 2020.
As if you think silver’s run has been impressive, platinum says “hold my beer.” Through today, platinum was up over 80% in the last six months, and as of last week, it was up over 86%. In futures pricing dating back to 1986, platinum has never had a larger six-month gain.
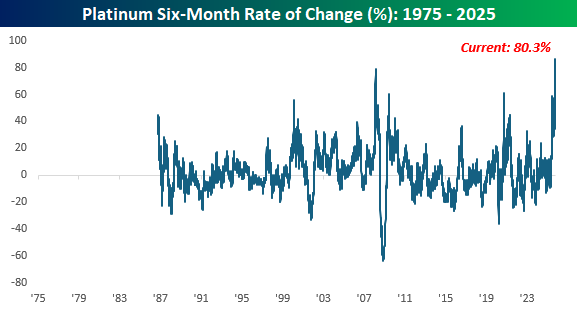
While all three metals have had widely varying rallies in the last six months, relative to their respective histories, their moves have ranked above the 95th percentile versus all other six-month periods. The charts below show the performance of gold, silver, and platinum since 1986, which is when we have pricing data for all three commodities. In each chart, we have also included red dots to show the times when all three metals simultaneously had six-month rallies that ranked in the 95th percentile or above of their respective histories.
The only other periods when all three metals simultaneously had six-month rallies that ranked in the 95th percentile or above were in May 2006, February to March of 2008, May to early June of 2009. and September 2020. Within the equity market, we often see overbought markets becoming more overbought, but in the case of these three metals, it wasn’t uncommon to see at least a short-term pullback following prior moves like the one we’ve seen recently.
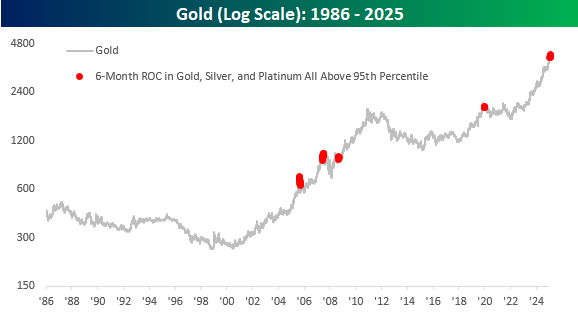
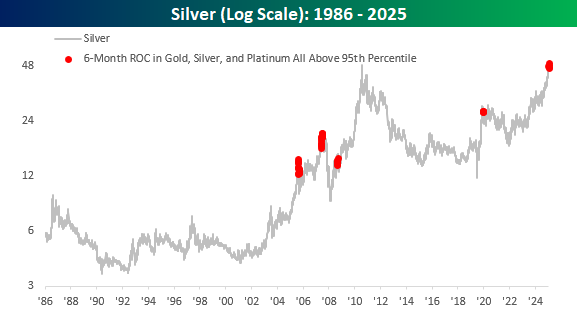
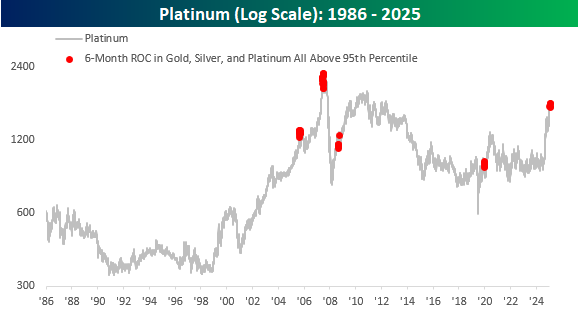
Chart of the Day: Friday’s Drop, Monday Gaps, Consumer Weakness
Bespoke’s Morning Lineup – 10/13/25 – Rebound
See what’s driving market performance around the world in today’s Morning Lineup. Bespoke’s Morning Lineup is the best way to start your trading day. Read it now by starting a two-week trial to Bespoke Premium. CLICK HERE to learn more and start your trial.
“Riches don’t make a man rich, they only make him busier.” – Christopher Columbus
Below is a snippet of commentary from today’s Morning Lineup. Start a two-week trial to Bespoke Premium to view the full report.
After a bout of ferocious selling on Friday for stocks and into the weekend for cryptocurrencies, investors took some time to think things through over the weekend, and they’re taking a more optimistic tone. Futures on the S&P 500 are 1% higher, while the Nasdaq trades up more than 1.5%. Bonds are closed for Columbus Day, but gold is sharply higher with a gain of over 2% and trading just under $4,100 per ounce. Crude oil is also bouncing back with a gain of 1.5% but is still trading below $60. It certainly could be worse, but even with this morning’s gains, the S&P 500 is still down well over 1% from Thursday’s close. The President may not like to see the stock market trade lower, but all the talk with China seems to have taken the shutdown off the front page of the business section.
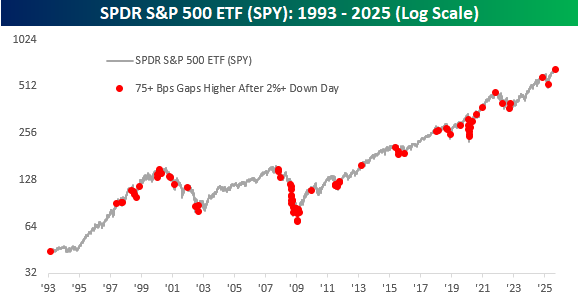
S&P 500 futures are still up over 1% but off their highs from earlier in the session. We looked at all prior periods when the S&P 500 SPDR ETF (SPY) fell 2% in a session and then gapped up at least 75 bps at the open the following day. We originally looked at 1% upside gaps, but with SPY now teetering on a 1% gain, we widened the band. The overall results of both analyses were very similar, though.
The long-term chart of SPY below shows every prior occurrence when SPY gapped up at least 75 bps after a 2%+ down day since its inception in 1993. While there were plenty of similar occurrences during the bear markets of 2000 to 2002 and 2008 into early 2009, there have also been plenty of other occurrences at various points in the market cycle.