Q4 2025 Earnings Conference Call Recaps: Prologis (PLD)
Bespoke’s Conference Call Recaps use AI to summarize lengthy earnings calls. The commentary below is AI-generated and then edited by Bespoke for quality control. As always, none of these summaries should be construed as recommendations to buy or sell any securities, and investors should do their own research and/or consult with a financial professional before making any investment decisions.
Our latest recap available to Bespoke subscribers covers Prologis’ (PLD) Q4 2025 earnings call.
![]()
Prologis (PLD) is the world’s largest industrial real estate company, owning approximately 1.3 billion square feet of logistics space across 20 countries. Serving over 6,500 customers, including giants like Amazon and FedEx, the firm manages the warehouses that power global trade, with roughly 3% of global GDP flowing through its facilities. PLD offers insight into consumption trends and supply chain health, while its “Essentials” platform expands its reach into renewable energy and digital infrastructure. In the Q4 2025 earnings call, management declared a market inflection point, noting that vacancy has peaked and rents are beginning to rise. The company signed a record 228 million square feet of leases in 2025, driven by a resurgence in e-commerce and a 300-basis-point outperformance of the US market. A major highlight was the pivot toward data centers, with a secured 5.7 GW power pipeline and plans for data centers to comprise 40% of 2026 development starts. Despite a higher open on 1/21, shares fell close to 1% following its revenue beat and in-line EPS report…
Continue reading our Conference Call Recap for PLD by becoming a Bespoke Institutional subscriber. You can sign up for Bespoke Institutional now and receive a 14-day trial to read our newest Conference Call Recap. To sign up, choose either the monthly or annual checkout link below:
Q4 2025 Earnings Conference Call Recaps: United Airlines (UAL)
Bespoke’s Conference Call Recaps use AI to summarize lengthy earnings calls. The commentary below is AI-generated and then edited by Bespoke for quality control. As always, none of these summaries should be construed as recommendations to buy or sell any securities, and investors should do their own research and/or consult with a financial professional before making any investment decisions.
Our latest recap available to Bespoke subscribers covers United Airlines’ (UAL) Q4 2025 earnings call.
![]()
United Airlines (UAL) is a leading global carrier serving 175 million customers annually across six continents. Beyond moving passengers, UAL provides global cargo logistics and operates one of the world’s most extensive loyalty ecosystems, MileagePlus. The company offers a window into high-end consumer health and global corporate activity, as it pivots toward “premiumization,” investing billions in high-margin products like United Polaris and Starlink Wi-Fi. UAL reported record Q4 revenue of $15.4 billion, surpassing estimates despite a $250 million hit from the US government shutdown. Management discussed a bifurcation in the industry, with United’s premium revenue surging 12% while low-cost competitors struggle with overcapacity. Management also detailed that global growth is currently capped by engine supply shortages rather than aircraft availability. Shares rose more than 2% on 1/21 after reporting EPS and revenue beats…
Continue reading our Conference Call Recap for UAL by becoming a Bespoke Institutional subscriber. You can sign up for Bespoke Institutional now and receive a 14-day trial to read our newest Conference Call Recap. To sign up, choose either the monthly or annual checkout link below:
Chart of the Day: The Presidency in Year Two
Q4 2025 Earnings Conference Call Recaps: Halliburton (HAL)
Bespoke’s Conference Call Recaps use AI to summarize lengthy earnings calls. The commentary below is AI-generated and then edited by Bespoke for quality control. As always, none of these summaries should be construed as recommendations to buy or sell any securities, and investors should do their own research and/or consult with a financial professional before making any investment decisions.
Our latest recap available to Bespoke subscribers covers Halliburton’s (HAL) Q4 2025 earnings call.
![]()
Halliburton (HAL) is a global company specializing in oilfield services, covering the entire lifecycle of a reservoir. It manufactures high-tech drilling equipment and provides essential services like hydraulic fracturing, cementing, and well construction. The company serves major national oil companies and independent producers across 70 countries. As the primary barometer for the North American shale market, Halliburton provides insights into global energy demand and the transition toward long-term energy security. HAL delivered $5.7 billion in revenue for Q4, above estimates of $5.4 billion. While North American revenue dipped 7% due to softer land activity, international markets surged 7%, particularly in Latin America and the North Sea. The dominant theme was a market rebalancing in 2026. Management expects equipment attrition to tighten the market quickly if demand rises. The most striking update was a potential rapid re-entry into Venezuela, where HAL could mobilize in weeks once legal terms are finalized. Additionally, a new 400 MW commitment for modular power systems positions the company to capitalize on the Eastern Hemisphere’s growing data center and AI infrastructure needs. HAL shares rallied close to 5% on 1/21 in reaction to better-than-expected results…
Continue reading our Conference Call Recap for HAL by becoming a Bespoke Institutional subscriber. You can sign up for Bespoke Institutional now and receive a 14-day trial to read our newest Conference Call Recap. To sign up, choose either the monthly or annual checkout link below:
Capital One’s Impressive Streak
“The profit margin for credit card companies now exceeds 50%. One of the biggest. And they charge Americans interest rates of 28%, 30%, 31%, 32%. What happened to usury?” – Donald Trump
The weekend before last, President Trump made some critical comments about the credit card companies, and he pushed for a 10% cap on the interest rates they’re allowed to charge. After sleeping on those headlines for the rest of that weekend, investors headed into the week looking to unload. As one example, Capital One (COF) opened sharply lower on that Monday and remains near those levels now. This morning, the President reiterated his critical comments towards the card companies in Davos and called on Congress to do something about it (since he can’t actually unilaterally cap rates himself).
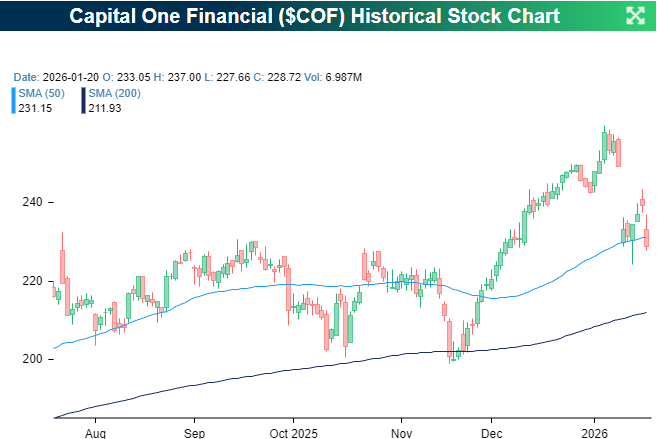
For COF specifically, the company will report earnings on Thursday after the close, and investors will be looking for any comments from company management regarding how they plan to react to the President’s animosity towards them and any legislative push that arises from it. We’re not sure exactly what (besides the mid-terms) made the President so focused on the credit card companies lately, but maybe it’s the performance of COF in reaction to its earnings reports over the last three years.
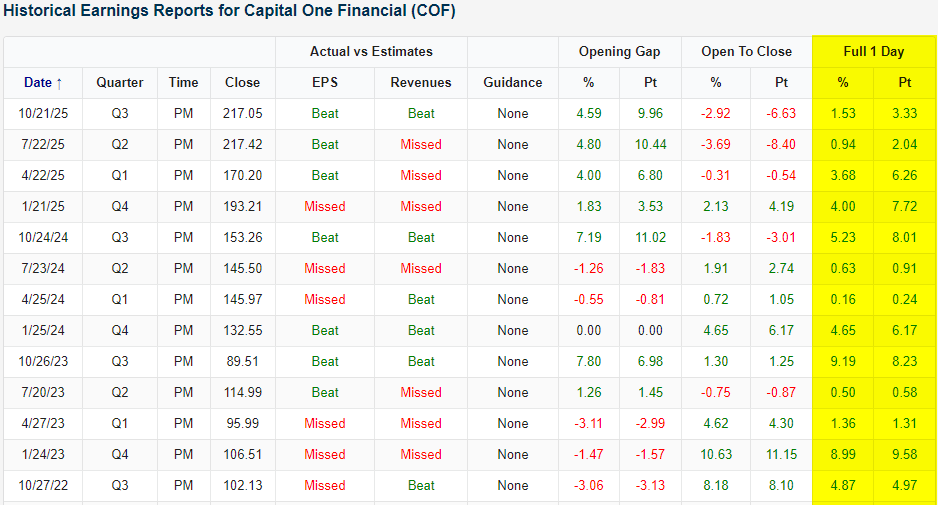
The snapshot below comes from our Earnings Explorer and shows COF’s earnings results and subsequent stock performance in reaction to each of those reports. Since the bull market began in October 2022, COF has exceeded EPS forecasts only 7 out of 13 times and beat sales forecasts just 6 times. Combined, the company has exceeded EPS and sales forecasts in the same earnings report only three times. Based on its results relative to expectations, it doesn’t appear as though COF has been minting money.
While COF’s earnings results haven’t been particularly strong, the stock’s reaction to those earnings reports has been stellar. As shown in the right side of the table, since Q4 2022, the stock’s earnings reaction day performance has been positive all 13 times for an average one-day gain of 3.5. Shares have seen one-day gains in response to earnings on each of its last 13 reports!
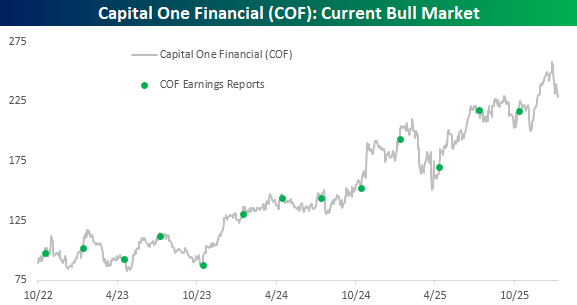
Besides the positive earnings reaction day performance, COF has been a very strong performer between earnings reports. Since the bull market began in October 2022, the stock has rallied 156%, which is 66 percentage points more than the S&P 500. It may not be the best performer in the S&P 500 during this bull market, but COF has been one of the better performers. That’s great if you’re a shareholder, but it also makes for an easy scapegoat when an issue like affordability is poised to be a central theme of this year’s mid-term elections. What other issue can you think of out there where Donald Trump and Elizabeth Warren would be on the same page?

Bespoke’s Morning Lineup – 1/21/26 – Sell America?
See what’s driving market performance around the world in today’s Morning Lineup. Bespoke’s Morning Lineup is the best way to start your trading day. Read it now by starting a two-week trial to Bespoke Premium. CLICK HERE to learn more and start your trial.
“A country, a style or an epoch are interesting only for the idea behind them.” – Christian Dior

Below is a snippet of commentary from today’s Morning Lineup. Start a two-week trial to Bespoke Premium to view the full report.
The week started on a down note, and as we approach the opening bell for the second trading day of the week, futures aren’t indicating anything in the way of a turnaround, as a previously modestly higher picture has turned red. Treasury yields are basically flat, while crude oil is modestly higher. Investors continue to pile into gold, though, as futures are up another 2%+. Unlike other days when gold rallies, though, other precious metals are seeing much more modest gains. Bitcoin is also lower once again and firmly back below $90K.
Outside of the US, Asian markets were mixed. The Nikkei was down 0.4%, but Hong Kong, China, and South Korea bucked the trend with modest gains. In Europe, the picture is much more uniform as major equity markets are down across the board. The STOXX 600 is down 0.6% with Germany leading the way lower.
For US markets this morning, we’ll get Leading Indicators, Construction Spending, and Pending Home Sales at 10 AM, but the main focus will be on Davos, where President Trump is scheduled to speak right about now.
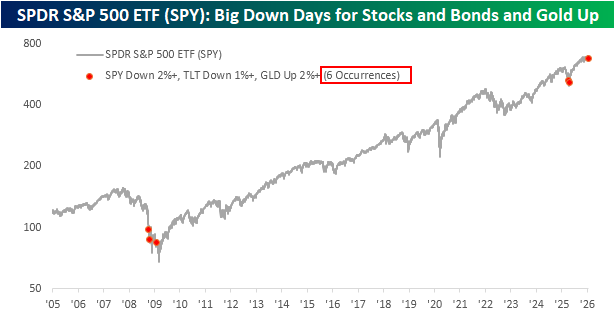
Yesterday was an interesting day in markets as the S&P 500 ETF (SPY) fell over 2% while long-term Treasuries, as proxied by the ETF TLT, also declined by over 1%. On their own, the weakness in both asset classes was hardly unprecedented. Since the start of 2005, there have been 212 other days when SPY fell more than 2%. For TLT, declines like yesterday are even more common, with 627 other one-day drops of at least 1%.
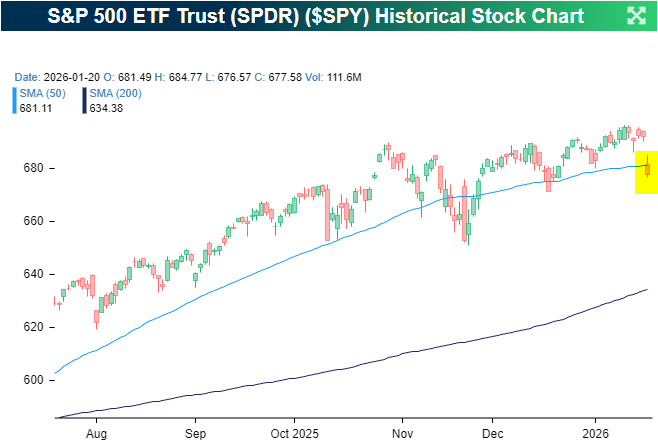
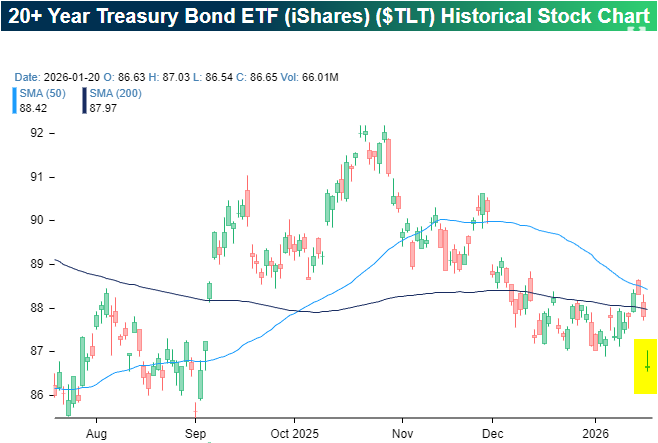
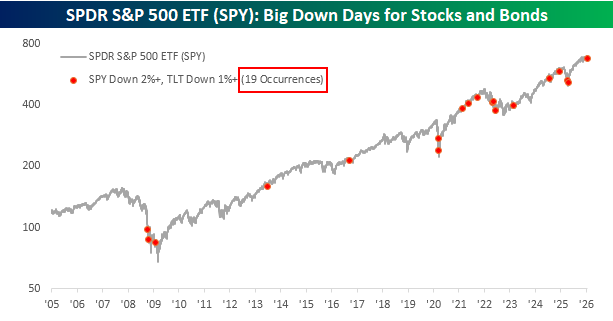
What made yesterday’s drops in both ETFs more notable was that they occurred in tandem with each other. Since the start of 2005, there have only been eighteen other days when SPY fell over 2%, and TLT dropped by more than 1% on the same day. The chart below shows the performance of SPY since the start of 2005, and the red dots indicate each of those other occurrences. There were multiple occurrences near the lows of the Financial Crisis in late 2008/early 2009. From mid-2009 up until the onset of Covid, there were only two other occurrences, but in the post-Covid era, the frequency of occurrences has been much more common as higher inflation has acted as a secular headwind for bonds and a tailwind for gold.
As uncommon as it is for the S&P 500 to drop at least 2% and long-term treasuries (TLT) to fall over 1% on the same day, what makes yesterday even more of an outlier is that Gold also surged more than 2%.
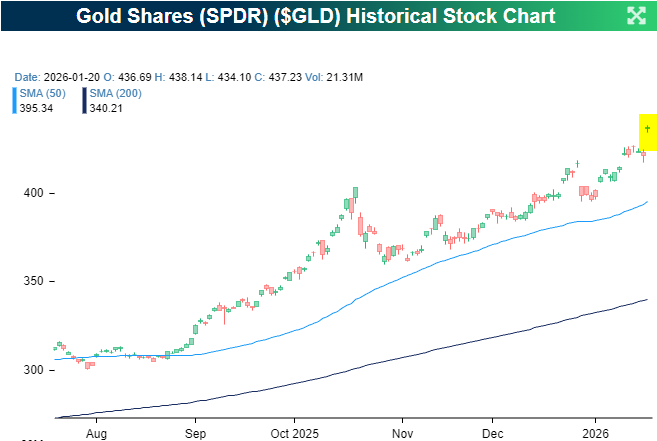
A 2%+ rally in Gold, on its own, isn’t all that uncommon. Yesterday was the 183rd occurrence since the start of 2005 and the 17th in just the last year, but this type of rally practically never happens on a day when the S&P 500 falls over 2% and long-term treasuries fall more than 1%. Since the start of 2005, it’s only happened five other times!
Following the President’s rhetoric towards Europe, and Greenland specifically, over the weekend, concerns over a pickup in the sell America trade started to resurface again yesterday, and the moves in US stocks, bonds, and gold yesterday could easily fit into that narrative. If global investors were looking to “sell America,” this is exactly the type of price action you would expect to see. But if investors were selling America, what were they buying?
Accounting for the losses on Monday when US markets were closed, there wasn’t a lot of buying in global stocks. Europe’s STOXX 600 was down about 2% from Friday’s close through Tuesday, and the Nikkei was down just as much. There wasn’t a lot of buying to be found in international bonds either, as yields in Europe also moved higher, and JGB yields surged to multi-decade highs.
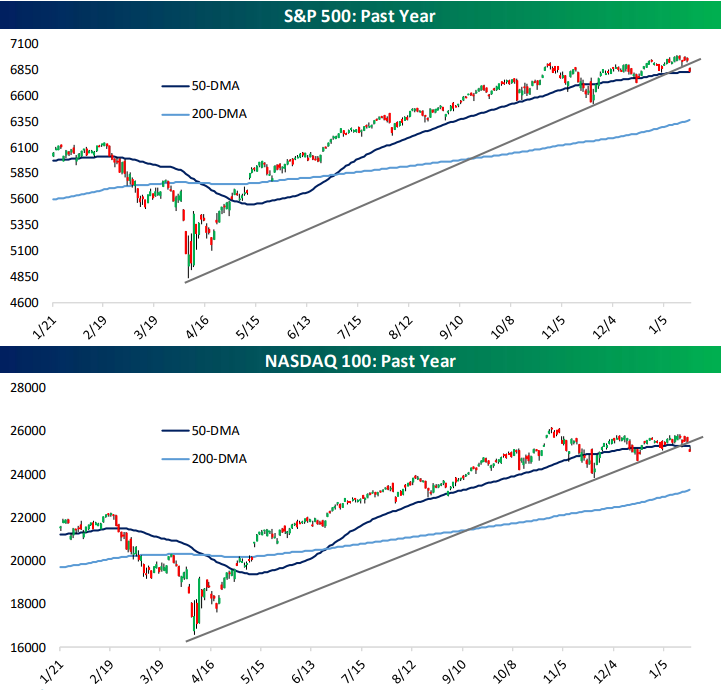
For now, it probably makes more sense to write off yesterday’s moves as a one-off and potentially traders just trying to front-run any potential sell-America trade, but investors should keep a close eye on how the markets react in the days ahead. What makes yesterday’s drops in stocks and bonds while gold rallied stand out even more though, was in where it occurred in the market cycle. As shown in the chart below, of the five other times when SPY fell over 2%, TLT fell more than 1%, and GLD rallied at least 2%, three occurred deep into the Financial Crisis, and the other two occurred right near the lows of the tariff-tantrum. Yesterday’s occurrence came just after the S&P 500 closed the prior session within 1% of an all-time high.
The Closer – Technical Troubles, Decline Deciles – 1/20/26
Log-in here if you’re a member with access to the Closer.
Looking for deeper insight into markets? In tonight’s Closer sent to Bespoke Institutional clients, we start out with a discussion of US financial asset purchase by the rest of the world in addition to a checkup on major index technicals (page 1). We then provide a decile breakdown of today’s declines (page 2) before finishing with a rundown of the latest Philly Fed numbers (page 3).
See today’s full post-market Closer and everything else Bespoke publishes by starting a 14-day trial to Bespoke Institutional today!
Daily Sector Snapshot — 1/20/26
Q4 2025 Earnings Conference Call Recaps: Fastenal (FAST)
Bespoke’s Conference Call Recaps use AI to summarize lengthy earnings calls. The commentary below is AI-generated and then edited by Bespoke for quality control. As always, none of these summaries should be construed as recommendations to buy or sell any securities, and investors should do their own research and/or consult with a financial professional before making any investment decisions.
Our latest recap available to Bespoke subscribers covers Fastenal’s (FAST) Q4 2025 earnings call.
![]()
Fastenal (FAST) is a maker of industrial and construction supplies, specializing in fasteners, safety gear, and MRO (Maintenance, Repair, and Operations) products. Beyond simple retail, the company is a supply chain powerhouse that embeds itself into customer workflows through Onsite locations (miniature warehouses inside client facilities) and FMI (Fastenal Managed Inventory) technology, an automated network of industrial vending machines and smart bins. FAST serves heavy manufacturing and construction clients, governments, and data centers. Fastenal capped a recovery year with a strong Q4, posting $2.03 billion in sales (up 11%) and record annual revenue of $8.2 billion. Despite a “sideways” industrial economy and mixed signals from the PMI, the company achieved market share gains by pivoting toward large-account “ultra-high spend” sites ($50K+ monthly), which now account for over half of revenue. A key highlight was the acceleration of FAST’s digital moat: FMI and eBusiness now represent 62.1% of sales, creating sticky relationships that outperformed the broader market. Looking toward 2026, FAST anticipates continued double-digit growth, supported by a fresh leadership transition with Jeff Watts named as the next CEO. FAST reported a revenue beat on in-line EPS, resulting in a loss as much as 5% for the stock on 1/20…
Continue reading our Conference Call Recap for FAST by becoming a Bespoke Institutional subscriber. You can sign up for Bespoke Institutional now and receive a 14-day trial to read our newest Conference Call Recap. To sign up, choose either the monthly or annual checkout link below:
First Year of Trump’s Second Term in the Books
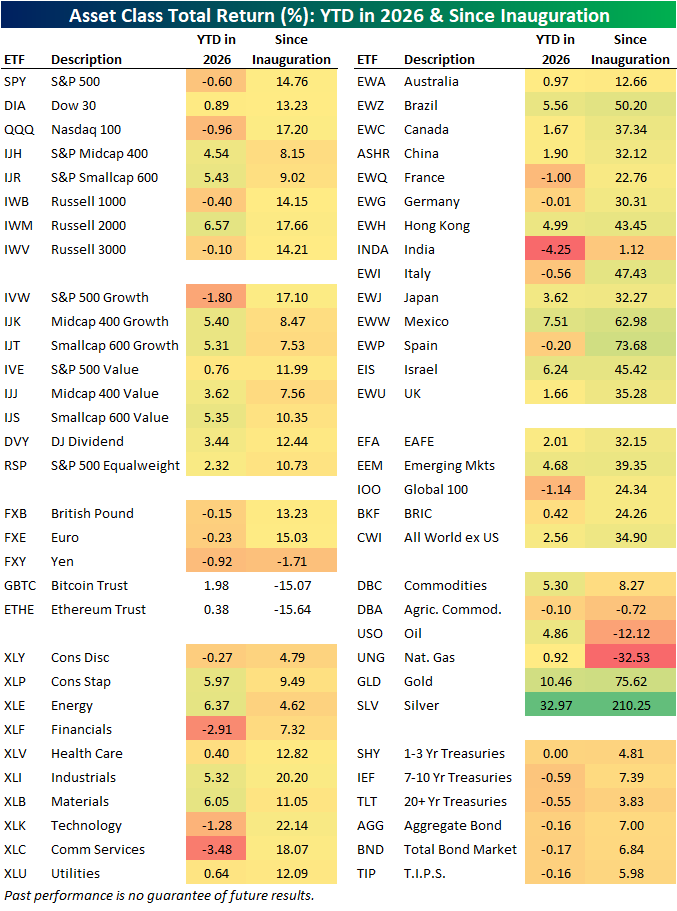
It has been one year since President Trump was sworn in for a second time. Looking back on the past year using our ETF asset class matrix below, the single best performing assets were precious metals with gold (GLD) up 75.6% and silver (SLV) providing an astounding 210.6% total return.
While their gains didn’t quite stack up to gold and silver, equities also had a respectable year. The major US indices all provided a total return ranging from high-single digits to the mid-teens with oversized gains from the small-cap Russell 2,000, large cap growth (IVW), and the Nasdaq 100 (QQQ).
On a sector level, traditionally cyclical areas were mixed as the likes of Energy (XLE), Consumer Discretionary (XLY), and Financials (XLF) underperformed with mid-single digit gains whereas Tech (XLK) and Industrials (XLI) both provided total returns surpassing 20%. Closing in on one month into the new year, there has been some rotation as XLE has rebounded while XLK is in the red.
While US equities did well in Trump’s first year, it was internationals that were the stars in the equity space. Of the fourteen country ETFs shown in the matrix below, only two underperformed the S&P 500 (SPY). Those were Australia (EWA) with a marginal 2 percentage points of underperformance and more meaningful lagging performance from India (INDA).
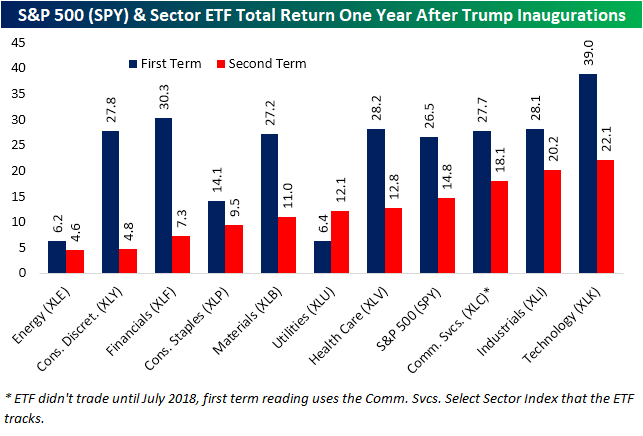
Looking back to the first time Trump was sworn in back in 2017, the year following saw an even larger gain for the S&P 500 ETF (SPY) as it offered a 26.5% return in Trump’s first year in the Presidency. For this second term, SPY is again higher but by about ten percentage points less. Taking it a step down, the only sector outperforming during this second term versus the first is Utilities (XLU), which is up 12.1% since last January; that compares to a 6.4% gain after the 2017 inauguration. Finally, we would note that whereas in 2017 there was a significant cluster (seven of the eleven sectors) with similarly-sized gains between 25% and 30%, this time there is a more gradual increase across sectors. With that said, Tech was the top performing sector in both periods, and the margin was much larger during the first term.
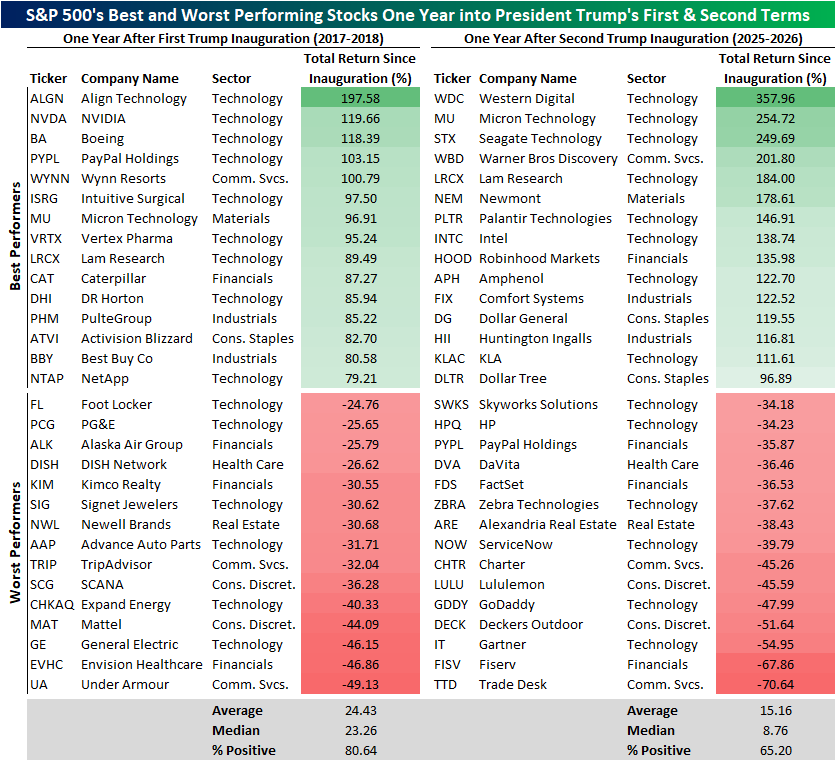
Below we include a look at the S&P 500’s individual best and worst stocks of the first year of Trump’s first and second terms. As shown, this second term has seen larger losses and larger gains for the best and worst stocks. In fact, of the 15 best performers of the past year, 14 more than doubled compared to only five from 2017 to 2018. Additionally, four stocks were more than cut in half this time around. Only Under Armor (UA) came close to that with a 49% loss after Trump’s first inauguration. Despite these big moves at the tail ends of the distribution, on the whole of S&P 500 members, average gains are smaller in the past year than they were from January 2017 to January 2018. Additionally, fewer stocks have risen (80% versus 65%).