Bespoke’s Morning Lineup – 10/29/25 – Anticipation Builds
See what’s driving market performance around the world in today’s Morning Lineup. Bespoke’s Morning Lineup is the best way to start your trading day. Read it now by starting a two-week trial to Bespoke Premium. CLICK HERE to learn more and start your trial.
“People don’t care about what you say, they care about what you build.” – Mark Zuckerberg

Below is a snippet of commentary from today’s Morning Lineup. Start a two-week trial to Bespoke Premium to view the full report.
It’s a day that doesn’t begin with “S” which these days means that stocks are poised to open higher with the S&P 500 indicated to open up 0.25% while the Nasdaq looks likely to gap up 0.43% at the open ahead of what will be a big day for earnings as three of the megacaps – Microsoft (MSFT), Alphabet (GOOGL), and Meta (META) – will report after the close. Also, don’t forget today’s Fed decision at 2 PM Eastern.
With equities indicated higher, treasury yields have also moved higher, but at 3.99%, the 10-year yield remains below 4%. Crude oil prices are slightly higher, while gold has rallied more than 1%, moving back above $4,000 per ounce.
In Asia, most indices were higher as positive headlines emerged from the President’s trip to the region. Consumer sentiment in Japan came in higher than expected, but inflation in Australia came in unexpectedly high. All eyes in the region will now shift to tomorrow’s meeting between President Trump and Chinese President Xi after headlines this morning suggest that China has already placed soybean orders with American farmers, while the US is likely to reduce fentanyl-related tariffs. The positive tone in Asia made its way over to Europe as the STOXX 600 rallies 0.3% with the UK and Spain up more than twice that.
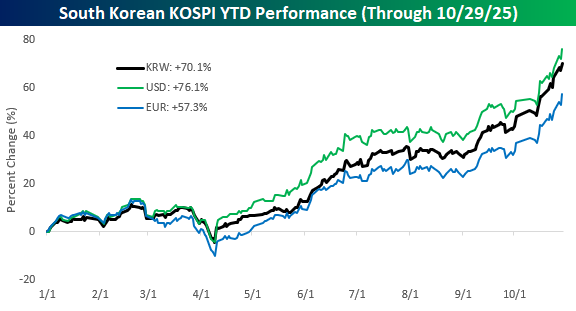
With Asian stocks mostly higher overnight, South Korea, after announcing a trade deal with the US, saw the KOSPI rally 1.8% to another in what has been a string of recent record highs. For the year, the KOSPI has now rallied more than 70%, which pretty much outdoes every other major stock market around the world on a YTD basis. Not only has the KOSPI rallied, but with its currency rallying against the dollar this year, from the perspective of a US investor, the gains are even greater at 76.1%. Even in euro terms, South Korean stocks are up over 57%!
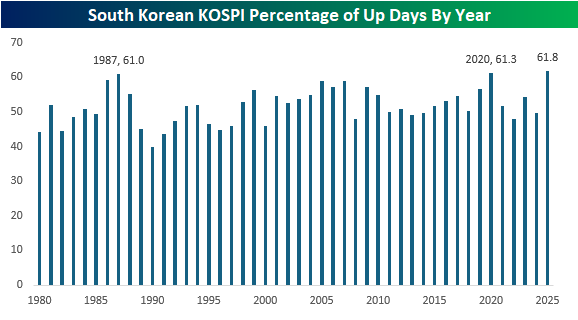
The gains in the KOSPI have also been consistent. Through last night’s close, the index traded higher on nearly 62% of all trading days, putting it on pace for the highest percentage of up days in a year on record. The only two other years when up days exceeded 60% were 1987 (61.0%) and 2020 (61.3%).
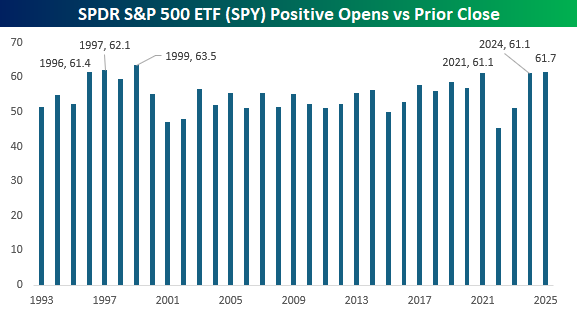
In the US, where we’ve seen strength this year has been at the opening bell. Just like today, the SPDR S&P 500 ETF (SPY) has gapped up at the open on 61.7% of all trading days. Since its inception, the only years with a higher percentage of positive gaps were 1999 (63.5%) and 1997 (62.1%), while 1996, 2021, and 2024 were the only three other years when SPY gapped up at the open more than 60% of the time.
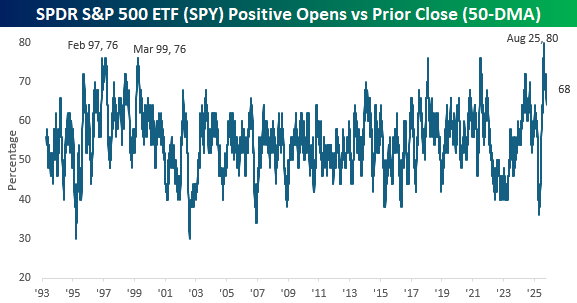
Much of the strength in SPY at the opening bell has come more recently since the tariff-tantrum. Over the last 50 trading days, SPY has gapped up at the open on more than two-thirds of trading days, and back in August, that percentage spiked up to a record high of 80%, exceeding the twin peaks of 76% from February 1997 and March 1999. What makes the current spike even more unique is the fact that it immediately followed a period of extreme selling at the open. Just as recently as this Spring, SPY gapped down on nearly two-thirds of all trading days, which was the lowest reading since December 2006.
The Closer – Worst Up Day Ever – 10/28/25
Log-in here if you’re a member with access to the Closer.
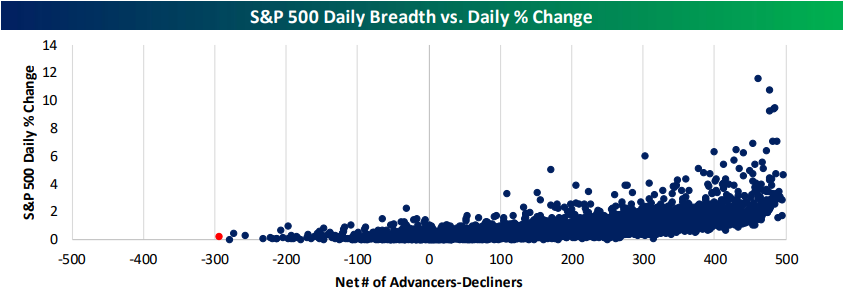
Looking for deeper insight into markets? In tonight’s Closer sent to Bespoke Institutional clients, we cover how since 1990, the S&P 500 has never had an up day with weaker breadth than today. We start out by covering this price and breadth divergence (page 1) followed by a look into volatility (page 2). After an earnings recap (pages 2 and 3), we dive into the latest consumer confidence figures (page 4) in addition to regional Fed manufacturing and service data (pages 5 and 6).
See today’s full post-market Closer and everything else Bespoke publishes by starting a 14-day trial to Bespoke Institutional today!
Daily Sector Snapshot — 10/28/25
Black Monday 1929, 96 Years Later
The story of Black Monday didn’t begin on October 28, 1929, but years earlier in the Roaring Twenties, when the US economy was seemingly unstoppable.

After the devastation of World War I, the US emerged as the world’s leading industrial power with a wave of technological innovation and cultural change.

The automobile, led by Henry Ford’s Model T, became affordable for the average American family thanks to assembly-line manufacturing.

Cars created demand for steel, rubber, glass, and oil, and massive investment in highways and suburban development. Electricity spread through cities, ushering in a new generation of appliances like refrigerators, radios, vacuum cleaners, and more that completely changed home life and consumer spending habits.

Factories became more efficient through mechanization and scientific management, boosting output while keeping costs low. Cities were flourishing as jazz music, flapper fashion, and Hollywood films carried a modern spirit.

With all of this new life, Americans, for the first time, embraced buying on credit. We know BNPL (Buy Now, Pay Later) well today, but it was also huge in the 1920s, as it allowed middle-class families to purchase all the goods they couldn’t have afforded before. Advertising boomed as companies learned to market their products, but also the lifestyles that represented happiness, modernity, and social status through consumption. Low interest rates and lax regulation made borrowing cheap and speculation rampant. Millions of Americans, factory workers, housewives, and seasoned investors alike, poured money into the stock market, often buying stocks on margin by putting down as little as 10%.

When stocks rose, returns on small initial investments were massive. But if share prices fell, the losses could be catastrophic. This worked as long as price kept climbing, and for most of the Roaring Twenties, they did. Brokers lent money freely because rising prices made loans look safe, and investors saw no reason to worry. Between 1924 and 1929, total margin debt soared to over $8.5 billion, or roughly $160 billion in today’s dollars and 6% of US GDP back then.
By early fall 1929, cracks were starting to show. Industrial production slowed, steel output dropped, and car sales weakened. The Federal Reserve warned about speculative excess, and a handful of economists began sounding alarms. Still, the Dow Jones had nearly tripled from 1926 levels, and overall confidence remained extremely complacent.
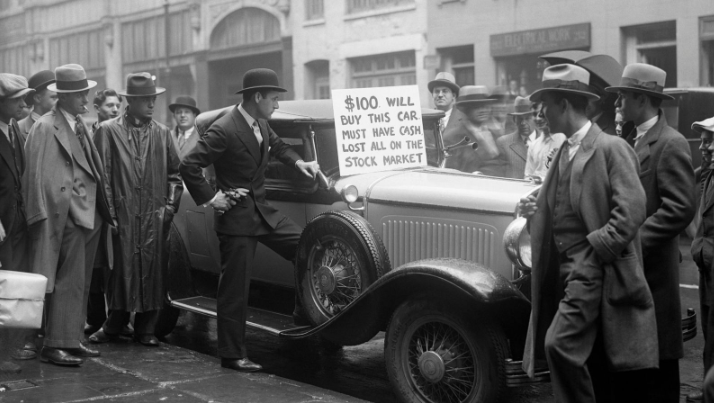
When the market began sliding in late October, panic spread quickly, and investor confidence was beginning to unravel as rumors of margin calls and large-scale sell orders spread through Wall Street. When brokers issued margin calls, demanding that investors either deposit more cash or sell shares to repay loans, most didn’t have the funds. So they sold, and sold at any price. Those forced sales pushed prices down further, triggering more margin calls and more selling in a downward spiral.
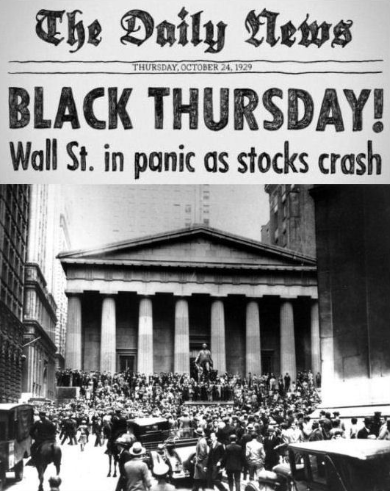
When trading opened on the morning of Thursday, October 24, panic selling began almost immediately. Volume surged to a record 12.9 million shares (nearly double a typical day), and it was so intense that the ticker tape fell hours behind, leaving traders blind to real-time prices. By late morning, the market seemed on the brink of total collapse. That’s when a group of leading bankers intervened. Led by Thomas W. Lamont of JPMorgan, they gathered at Morgan’s Wall Street headquarters and pledged hundreds of millions of dollars to stabilize the market. Richard Whitney, vice president of the New York Stock Exchange, strode onto the trading floor and loudly placed massive buy orders on behalf of the group, most notably for US Steel at $205 per share, well above its last trade. Panic subsided temporarily, and the market closed with smaller losses.
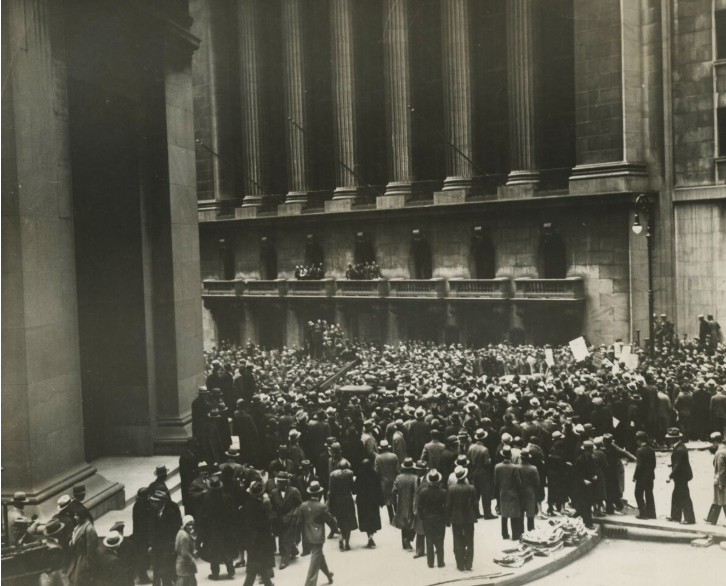
On Black Monday, October 28, 1929, the dam broke. From the opening bell, sell orders overwhelmed the exchange. The ticker tape immediately fell hours behind as clerks struggled to record the flood of transactions. Shares of iconic names like US Steel, General Electric, American Telephone & Telegraph, and Montgomery Ward, plummeted. Blue-chip stocks that had seemed invincible only weeks earlier were in free fall. And unlike the prior Thursday, on Black Monday, there would be no cabal of bankers to try and step in to prop things up again.
By day’s end, the Dow had fallen more than 13%. With communication technology still primitive, many investors had no idea how much they had lost until the next morning when the newspapers printed closing prices.
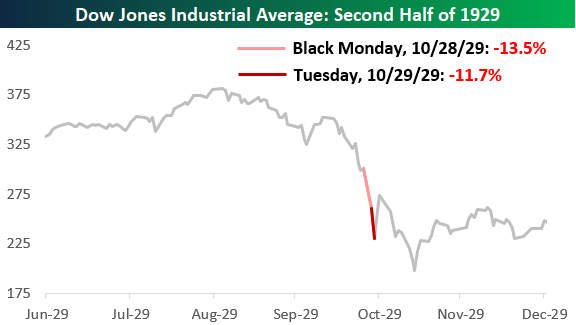
The next day, Black Tuesday, only made matters worse as the Dow fell an additional 12%. In just two trading days, nearly a quarter of the market’s value evaporated.
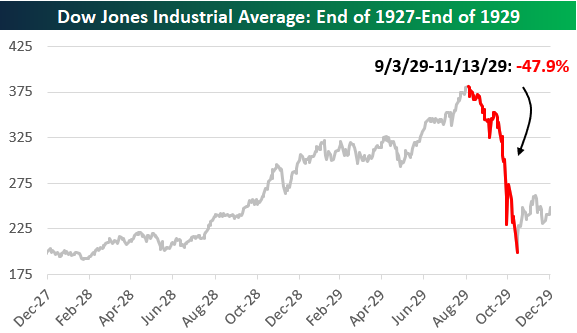
By mid-November, the Dow had lost nearly half its value from its September peak.
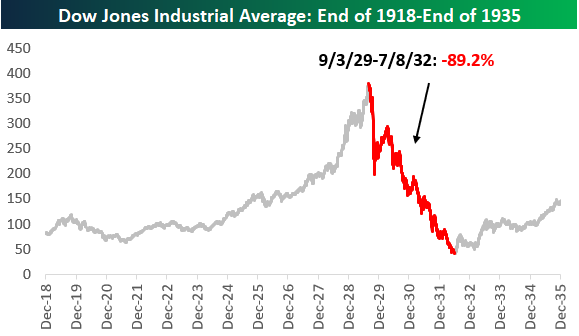
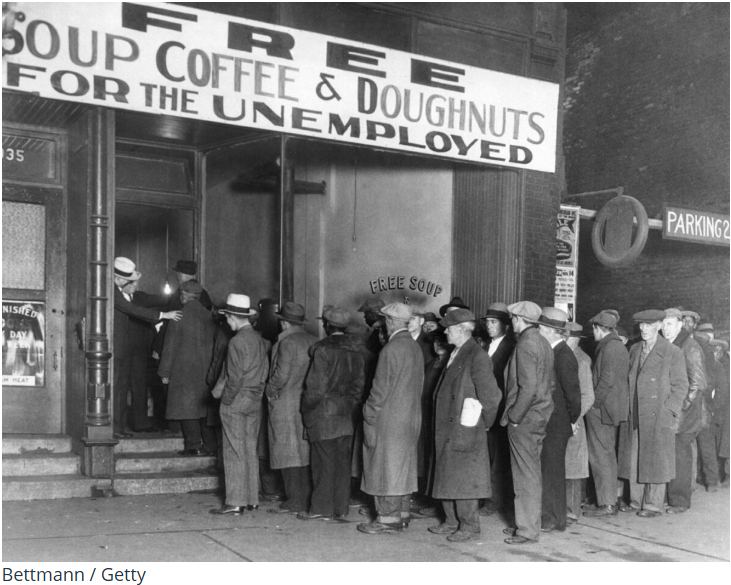
Though the market saw brief rallies in 1930, the damage was done. The crash destroyed public faith in the financial system and triggered a cascading economic breakdown. Over the next few years, banks failed by the thousands, unemployment soared past 20%, and the US entered the Great Depression, the worst economic crisis in modern history. From its high on September 3rd, 1929 to its low less than three years later on July 8th, 1932, the Dow fell 89.2%! It was basically Armageddon for equity investors.
The story of Black Monday reveals how speculative bubbles, fueled by easy credit and public euphoria, could lead to catastrophic collapses once confidence cracks. The crash also exposed the lack of safeguards. There were no circuit breakers, no deposit insurance, and little regulation of securities trading. In response, the US government passed the Securities Act of 1933, the Securities Exchange Act of 1934, and created the Securities and Exchange Commission (SEC) to restore transparency and accountability. It also gave rise to a new economic philosophy, Keynesianism, which argued for active government intervention to stabilize the economy during downturns.
While painful, many investors would say that stock market crashes are a necessary part of the investing cycle. They serve as painful but powerful reminders that markets don’t move in straight lines and that risk is always present, even during the most euphoric bull markets. Without periodic corrections, investors get complacent, assuming valuations and prices will only go higher, and that mindset breeds bubbles. When a crash occurs, it resets everything, and that’s exactly what happened after 1929.
The impact of a major crash often lasts for years or even generations. Investors who lived through 1929, 1987, 2000, or 2008 carried the scars and lessons for decades. These events shape behavior and sentiment long after prices recover, often preventing excessive optimism from taking hold too easily in future cycles. In that sense, crashes help maintain balance in the market ecosystem, reminding investors that humility, diversification, and discipline are just as important in good times as they are in bad.
As crashes fade further into the rear-view mirror, the collective memory of risk begins to erode. A new generation of investors, many of whom have only known bull markets, enters the scene without having experienced the emotional and financial pain of a true downturn. They may see volatility as opportunity rather than danger, underestimate how quickly sentiment can turn, and begin to take on more risk than they realize. This gradual loss of fear can inflate valuations, fuel speculative behavior, and create an environment where even modest corrections feel shocking.
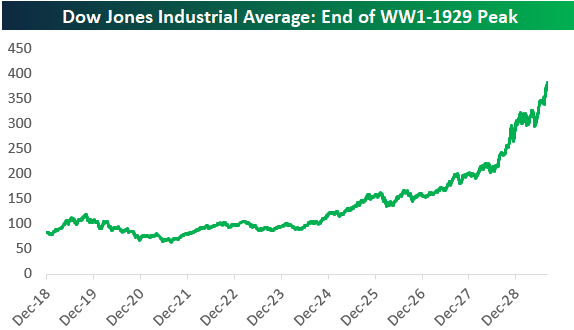
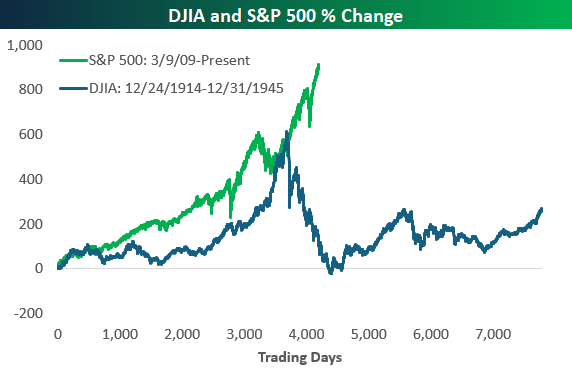
Amazingly, the S&P 500’s gains since the last big crash, the Financial Crisis, have easily eclipsed the gains seen in the Dow Jones Industrial Average during the Roaring 20s. From its low point after shutting down for four months at the onset of World War I to its peak in September 1929, the Dow gained about 616% (price only). Since March 9th, 2009 when the S&P bottomed after the Financial Crisis, the S&P is up 916%.
While we’re not predicting the next market crash, always remember that every long bull market eventually gives way to periods of fear and decline. The deeper and longer a rally runs, the easier it becomes for investors to forget how painful those downturns can be, and how quickly confidence can vanish. Using past crashes as a reference point isn’t about expecting history to repeat exactly, but about keeping perspective.
New to Bespoke? We’d love for you to give our equity research platform, Bespoke Premium, a try. You can sign up for complimentary access for 14 days at this link to start receiving our daily emails today!

B.I.G. Tips – Fed Days: Messy Streak of Final Hour Gains
Chart of the Day – Tale of Two Weeks
The Rapid Evaporation of Liquidity
The following is an in-depth analysis of tightening liquidity in the repo and Fed Funds markets that was included in our post-market macro note, The Closer, on 10/27/25. Start a trial here to receive our Closer in your inbox daily for the next two weeks!
One area of interest for the FOMC this week that has little to do with the economy or the lack of data due to the government shutdown is the rapid evaporation of liquidity over the past few months. For the purposes of this discussion, when we say “liquidity” we mean sufficient supplies of liquid assets in the repo market and Fed Funds market to keep rates on the target set by the FOMC.
To illustrate, below we show the spread between the midpoint of the Fed Funds target range and market repo rates captured by the Secured Overnight Funding Rate (SOFR) benchmark that replaced LIBOR. SOFR is volume-weighted median repo rate and includes both tri-party repo where large batches of securities are financed via a clearing bank and delivery-versus-payment transactions which can reference general collateral or specific issues. It’s a comprehensive snapshot of repo markets and the rates they charge.
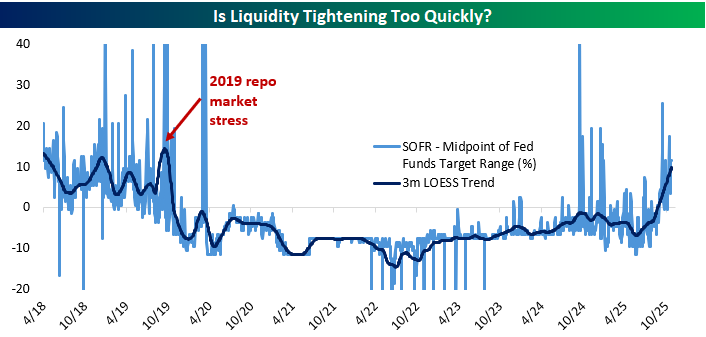
This spread is quite volatile, so we show it with a LOESS trend, a form of regression designed to isolate the central tendency of a series with respect to time. Think of it as a fancier version of a moving average. As shown above, while there were some spikes in the spread last fall, the trend never moved above zero and was well below its current range (around 10 bps above the midpoint). Since the start of September, there have been four different days when SOFR printed above the Fed Funds target range ceiling.
As for the trend, it’s now the highest since the fall of 2019 when repo rates surged thanks to excess runoff during the quantitative tightening program of the time. If repo were to print consistently above the Fed Funds target range, it would represent a failure of monetary policy to control short-term interest rates, which would be a huge problem for implementation of monetary policy.
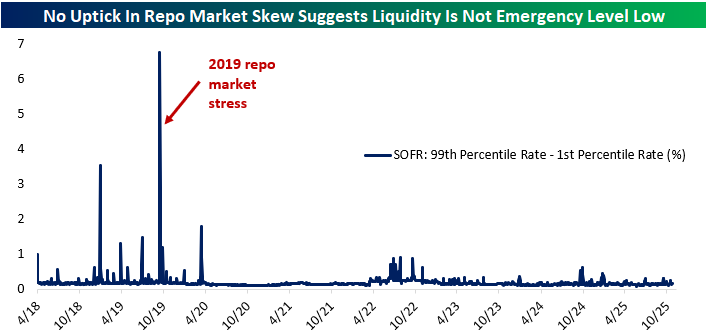
The good news is that the financial system looks less desperate for liquidity now than it did then. For example, the spread between 99th percentile (highest) and 1st percentile (lowest) rates in the SOFR distribution has not risen dramatically as it did during that fall 2019 stress period.
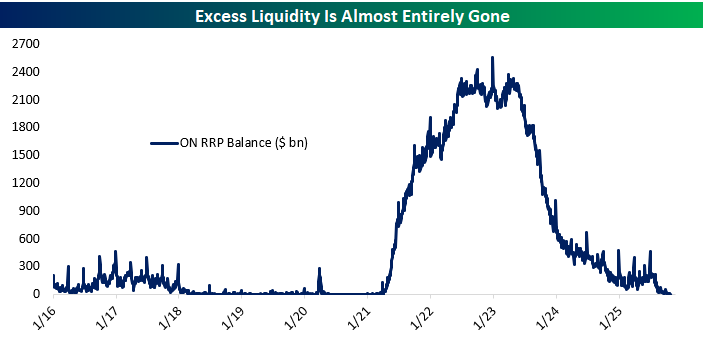
We’ve been noting the steady decline in the volume of excess reserves (proxied by the uptake for the Fed’s overnight reverse repo facility or ON RRP, which sterilizes excess liquidity from the financial system) for some time now.
As shown in the chart below, the balance in that facility has fallen steadily but it remains a few billion dollars above zero; in other words, there is still some excess liquidity in pockets that is being deposited with the NY Fed via this repo tool. On the other hand, quantitative tightening was slowed by the FOMC earlier this year in part because liquidity has evaporated faster than expected.
The concern is that they will accidentally roll off too many securities, starving the financial system of liquidity since security assets of the Fed are funded by the reserve liabilities which underpin liquidity conditions.
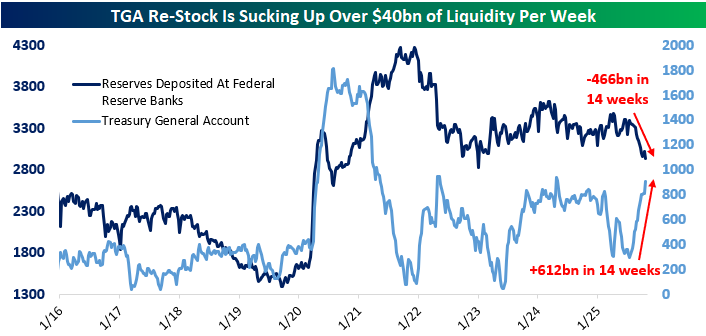
In addition to rolloff, the more acute driver right now has been the surge in the Treasury General Account. After passage of the OBBB this past summer, the debt limit was raised which allowed Treasury to rebuild its cash position (the TGA is effectively Treasury’s checking account). As shown below, it’s risen by over $600bn in the past three months.
Since the TGA is a liability of the Fed, assuming no change in Fed assets (and because of rolloff they are actually declining right now) increases in the TGA reduce liquidity elsewhere. Reserve assets of banks have fallen by over $450bn in the same period, illustrating the reduction of liquidity thanks to the changing composition of the Fed’s balance sheet.
In addition to rolloff and the TGA balance rising, we also note that banks are illustrating a very strong preference to hold reserves in recent years.
Reserves as a share of assets surged from 2008 to 2014 as QE created reserves that banks had to hold (as no other entities can hold them by law). The QE asset swap (which converts private sector holdings of bonds to holdings of deposits, with banks matching those deposit liabilities with reserve assets and the Fed matching reserve liabilities with security assets) meant reserves soared as a share of bank assets.
QT during the late 2010s drove down the share, but ultimately it bottomed (and created liquidity issues) at much higher levels than pre-crisis. That elevated reserve asset allocation by banks was driven mostly by post-GFC regulation which required greater liquidity in bank assets; reserves are by far the most liquid asset available. Another round of QE during COVID drove bank reserves as a share of assets back up again, but they’ve since stayed stable around 13% instead of falling to single digits.
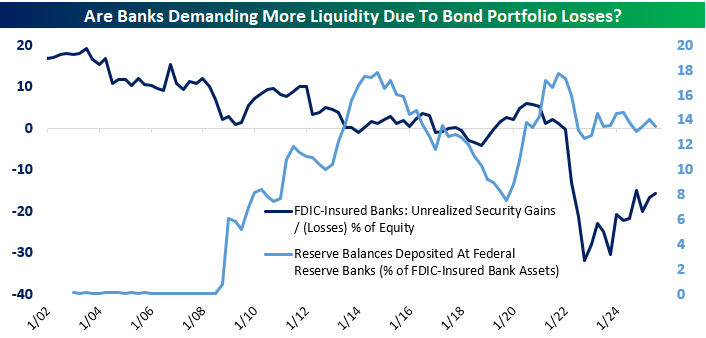
That may be in part because banks are sitting on significant paper losses in bond portfolios purchased during the COVID stimulus. As shown above, at their peak, unrealized losses were almost one-third of banking system equity capital. As rates have stopped rising and bonds have amortized, unrealized losses have declined. But in the meantime, bank treasury managers appear to be keeping holdings of reserves elevated in order to offset the risk that a need for liquid assets could force sales of bonds.
In other words, banks are holding more cash (reserves) than they otherwise might so they don’t have to book losses by selling bonds marked far above market prices, which would reduce the book value of equity. Over time, those underwater bonds will amortize down and asset growth will reduce their relevance, which is what has happened since 2021. But while that process plays out demand for reserves will remain inflated and combined with QT and the TGA rebuild liquidity conditions are tight as a result.
Taken together, we would not be surprised to see the FOMC halt QT in aggregate (while continuing to shift composition of the balance sheet away from mortgage bonds and towards Treasuries, a process which should not have a significant effect on liquidity conditions).
On the other hand, there is an insurance policy: since 2019, the FOMC has stood up an equivalent to the ON RRP designed to automatically provide liquidity via repo markets rather than remove it. So far that tool has not been used and Fed repo assets (provision of liquidity to the financial system via repo) has been negligible. Either way, expect some questions about liquidity for Chair Powell and in the minutes to this meeting when they are released at a lag.
One final note. This evolving liquidity backdrop makes Dallas Fed President Lorie Logan’s September 25 speech (link) calling to move the policy target from the Fed Funds rate to a repo rate all the more interesting. While this doesn’t seem likely to happen soon, it’s a good example of how liquidity management is constantly evolving.
Start a Bespoke Institutional trial here to receive our post-market macro note, The Closer, in your inbox each day for the next two weeks!
Bespoke’s Morning Lineup – 10/28/25 – Mixed Under the Surface
See what’s driving market performance around the world in today’s Morning Lineup. Bespoke’s Morning Lineup is the best way to start your trading day. Read it now by starting a two-week trial to Bespoke Premium. CLICK HERE to learn more and start your trial.
“We are like chameleons, we take our hue and the color of our moral character, from those who are around us.” – John Locke
Below is a snippet of commentary from today’s Morning Lineup. Start a two-week trial to Bespoke Premium to view the full report.
After a positive start to the week, stocks are taking a breather this morning as S&P 500 and Nasdaq futures are indicated just fractionally higher, while a 5%+ rally in UnitedHealth (UNH) in reaction to earnings has the Dow indicated to open up closer to 0.40%. The muted gains in the US follow what has mostly been a modestly negative session in Asia and Europe.
The pace of earnings has really picked up, and tomorrow will be the biggest day of earnings season in terms of market cap with Microsoft (MSFT), Alphabet (GOOGL), and Meta (META) all on deck to report. Besides earnings reports, this morning we’ll also get the October Richmond Fed report and Consumer Confidence at 10 AM Eastern.
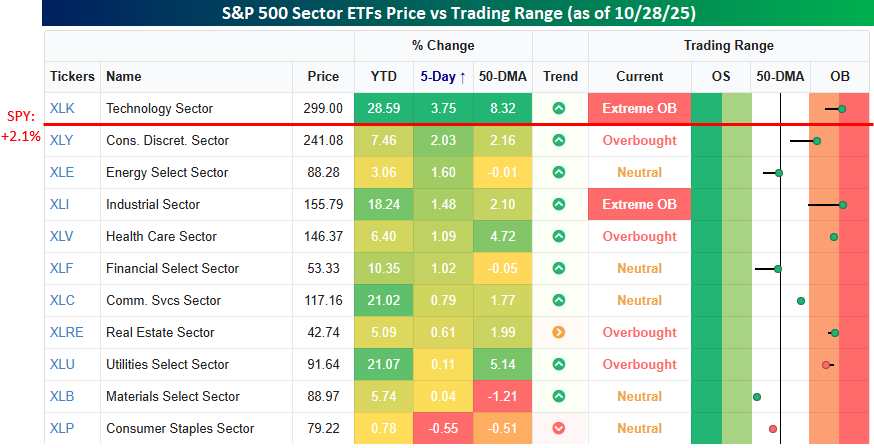
It’s been quite a week for stocks as the major US equity indices have broken out to new record highs, and S&P 500 7000 has entered the conversation. As noted in yesterday’s Chart of the Day, though, breadth has been somewhat weak. Another example of that weak breadth is in overall sector performance. As shown in the snapshot below showing sector ETF performance, over the five trading days ended yesterday, the only one outperforming SPY is Technology (XLK) with a gain of 3.75%. Consumer Discretionary (XLY) is close (2.03% vs 2.10%) but not good enough. Besides XLY, the only two other sector ETFs whose performance is within even one percentage point of the S&P 500 are Energy (XLE) and Industrials (XLI).
At the other end of the spectrum, the sectors underperforming are mostly what you would expect to see in an environment where the market rallies. Consumer Staples (XLP) is the lone decliner with a loss of 0.55% while Materials (XLB) and Utilities (XLU) have only seen modest gains of 0.10% or less. While XLU has underperformed over the last week, it remains one of just three sectors with a gain of more than 20% on the year.
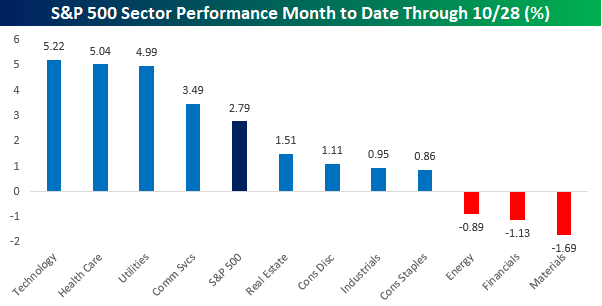
Shifting focus, with the government shutdown now set to enter its fifth week at midnight tonight, we wanted to look at how sectors have performed so far this month to see what, if any, impact it has had on performance. With a gain of 2.8% MTD through yesterday, it’s hard to say that the market has been impacted. Leading the way higher, Technology, Health Care, and Utilities have all seen gains of 5% or more, while Communication Services is the only other sector that has outperformed the S&P 500. To the downside, Materials (-1.69%), Financials (-1.13%), and Energy (-0.89%) are the only sectors to have experienced declines. It’s also worth noting that Consumer Discretionary has managed a gain of just over 1%, so even with so many Americans relying on the Federal government for either pay or benefits, and those paychecks and benefits poised to dry up, at least temporarily, it appears that the sector has held up.
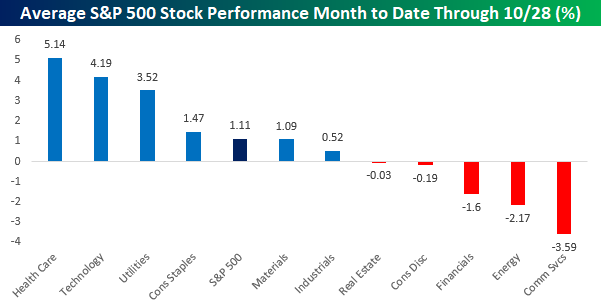
There’s always a but, though. If we look at sector performance on an unweighted basis, performance for the month looks much different. For the market as a whole, while the cap-weighted index is up 2.79%, on an unweighted basis, the gain is less than half that at 1.11%. One of the most notable shifts in performance, though, is in the Consumer Discretionary sector where the 1.11% gain on a market cap weighted basis shifts to a decline of 0.19% on an unweighted basis as MTD gains in the sector’s trillion dollar stocks (Amazon.com and Tesla) don’t carry nearly the weight on an equal-weighted as they do on a cap weighted basis.
The Closer – Six Months Above, Liquidity, TGA – 10/27/25
Log-in here if you’re a member with access to the Closer.
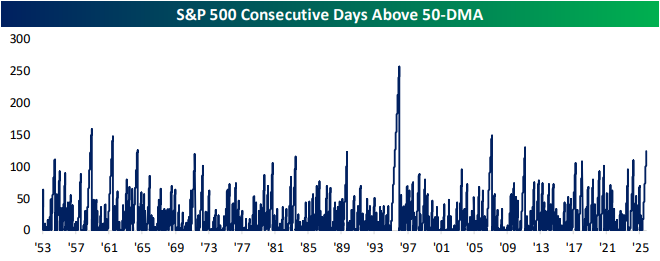
Looking for deeper insight into markets? In tonight’s Closer sent to Bespoke Institutional clients, we start by showing the S&P 500 closing in on six straight months of trading above its 50-DMA (page 1) followed by a dive into some concerns for the liquidity of the repo market (pages 2-4). We then cover a bunch of the latest earnings reports (page 4&5) before closing out with an update of our Five Fed Manufacturing Composite (page 6) .
See today’s full post-market Closer and everything else Bespoke publishes by starting a 14-day trial to Bespoke Institutional today!