Energy Surge Relative to Industrials
Each day in our Sector Snapshot, we provide an update on each sector’s weighting within the S&P 500. Given the astounding rally in Energy stocks, the sector has gone from a record low weighting of only 1.9% in November 2020 up to a high of 4.9% last week. That is back to levels seen in the summer of 2019, and it’s also a level consistent with what we saw in the late 1990s through the first few years of the 2000s. Of course, the larger a sector’s weighting, the more impact its moves have on the broader S&P 500.
Meanwhile, another traditionally cyclical group, the Industrials, has seen its weighting steadily decline. At only 7.76%, the current reading is only about 0.3 percentage points above the pandemic low in weight which also marked a record low going back to at least 1990. Historically, Industrials have had less dramatic fluctuations in weight than Energy, but it has seen a consistent grind lower over the decades, reflecting the broader shift in the US economy from predominately goods to service-based.

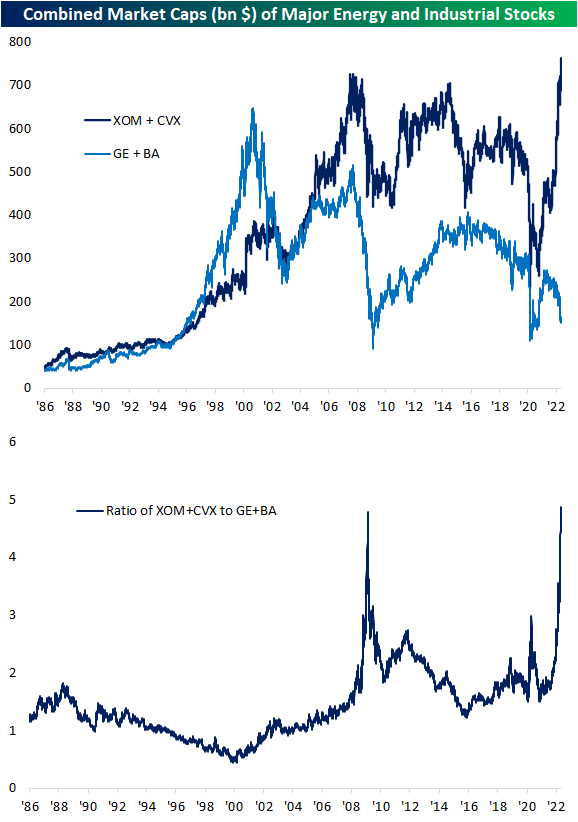
In an earlier post, we noted how two of the biggest stocks in the Energy sector by market cap, Exxon Mobil (XOM) and Chevron (CVX), have seen explosive and unprecedentedly large moves higher over the past couple of years. This is the first time these stocks have seen their market caps rise in any sort of a significant manner since the mid-2000s. As shown below, the two now account for nearly three-quarters of a trillion dollars in market cap, surpassing the previous peak in late 2007. That accounts for roughly 44% of the total size of the S&P 500 Energy sector as well.
Below we compare the combined market caps of XOM and CVX to what have historically been two of the most prominent stocks in the Industrials sector: Boeing (BA) and General Electric (GE). Right around 2000, these two stocks had a combined market cap of ~$650 billion. Over the two decades since then, these two stocks have fallen from grace with their current market caps now totaling just $163.9 billion! Relative to the market cap gains of Exxon Mobil and Chevron, the recent move has been nothing short of exponential as shown in the second chart below. The only comparable period was in 2009 when both groups fell, but the Industrial names were hit much harder.
As we discussed in regards to Tech stocks now versus the Dot Com Peak in March of 2000 in last week’s Bespoke Report (pages 20 & 21), the big declines in the size of GE and BA as XOM and CVX rocket higher are yet more examples of the ebb and flow of market leadership. Click here to learn more about Bespoke’s premium stock market research service.
Daily Sector Snapshot — 6/1/22
Bespoke Market Calendar — June 2022
Please click the image below to view our June 2022 market calendar. This calendar includes the S&P 500’s average percentage change and average intraday chart pattern for each trading day during the upcoming month. It also includes market holidays and options expiration dates plus the dates of key economic indicator releases. Click here to view Bespoke’s premium membership options.

Q1 Earnings Season Conference Call Recaps
Bespoke’s Conference Call Recaps provide helpful summaries of corporate conference calls throughout earnings season. We go through the conference calls of some of the most important companies in the market and summarize key topics covered by management. These recaps include information regarding each company’s financial results, growth by segment, as well as some aspects of the business that management expects to impact future results. We also identify trends emerging for the broader economy in these recaps.
Bespoke’s Conference Call Recaps are available at the Bespoke Institutional level only. You can sign up for Bespoke Institutional now and receive a 14-day trial to read our newest Conference Call recaps. To sign up, choose either the monthly or annual checkout link below:
Bespoke Institutional – Monthly Payment Plan
Bespoke Institutional – Annual Payment Plan
Below is a list of the Conference Call Recaps published during the Q1 2022 and Q4 2021 earnings reporting period.
Q1 2022 Recaps:
Salesforce — Q1 2023

NVIDIA — Q1 2023

Best Buy — Q1 2023

Zoom — Q1 2023

Deere — Q2 2022

Palo Alto Networks — Q3 2022

Target — Q1 2022

Q1 Previously Published Recaps
Home Depot Q1 Conference Call — 5/17/22
Walmart Q1 Conference Call — 5/17/22
Disney Q2 Conference Call — 5/11/22
Roblox Q1 Conference Call — 5/11/22
Simon Property Q1 Conference Call — 5/9/22
Tyson Foods Q2 Conference Call — 5/9/22
Block Q1 Conference Call — 5/5/22
Albemarle Q1 Conference Call — 5/5/22
Cheniere Energy Q1 Conference Call — 5/4/22
Uber Q1 Conference Call — 5/4/22
Starbucks Q1 Conference Call — 5/3/22
Advanced Micro Devices Q1 Conference Call — 5/3/22
Hilton Hotels Q1 Conference Call — 5/3/22
Amazon Q1 Conference Call — 4/28/22
Apple Q2 Conference Call — 4/28/22
United Rentals Q1 Conference Call — 4/28/22
McDonald’s Q1 Conference Call — 4/28/22
Meta Platforms Q1 Conference Call — 4/27/22
Automatic Data Processing Q3 Conference Call — 4/27/22
Chipotle Q1 Conference Call — 4/26/22
Microsoft Q3 Conference Call — 4/26/22
Alphabet Q1 Conference Call — 4/26/22
United Parcel Service Q1 Conference Call — 4/26/22
Whirlpool Q1 Conference Call — 4/25/22
Coca-Cola Q1 Conference Call — 4/25/22
American Express Q1 Conference Call — 04/22/22
Snap Q1 Conference Call — 04/21/22
Pool Corp Q1 Conference Call — 04/21/22
Alcoa Q1 Conference Call — 04/20/22
Tesla Q1 Conference Call — 04/20/22
IBM Q1 Conference Call — 04/19/22
Johnson & Johnson Q1 Conference Call — 04/19/22
JB Hunt Conference Call — 04/18/22
Citigroup Q1 Conference Call — 04/14/22
UnitedHealth Group Q1 Conference Call — 04/14/22
Taiwan Semiconductor Q1 Conference Call — 04/14/22
BlackRock Q1 Conference Call — 04/13/22
Delta Q1 Conference Call — 04/13/22
JP Morgan Q1 Conference Call — 04/13/22
CarMax Q4 Conference Call — 04/12/22
Constellation Brands Q4 Conference Call — 4/7/22
Walgreens Q2 Conference Call — 3/31/22
Micron Q2 Conference Call — 3/29/22
Lululemon Q4 Conference Call — 3/29/22
KB Home Q1 Conference Call — 3/23/22
Adobe Q1 Conference Call — 3/22/22
Nike Q3 Conference Call — 3/21/22
Recaps published during Q4 2021 are available with a Bespoke Institutional subscription:
Salesforce Q4 Conference Call — 3/1/22
Target Q4 Conference Call — 3/1/22
Zoom Q4 Conference Call — 2/28/22
Moderna Q4 Conference Call — 2/24/22
Home Depot Q4 Conference Call — 2/22/22
Deere Q1 Conference Call — 2/18/22
Walmart Q4 Conference Call — 2/17/22
NVIDIA Q4 Conference Call — 2/16/22
Airbnb Q4 Conference Call — 2/15/22
Marriott Q4 Conference Call — 2/15/22
Advance Auto Parts Q4 Conference Call — 2/14/22
Uber Q4 Conference Call — 2/9/22
Disney Q1 Conference Call — 2/9/22
Chipotle Q4 Conference Call — 2/8/22
Simon Property Q1 Conference Call — 2/7/22
Tyson Foods Q1 Conference Call — 2/7/22
Snap Q4 Conference Call — 2/3/22
Amazon Q4 Conference Call — 2/3/22
Estée Lauder Q2 Conference Call — 2/3/22
Meta Q4 Conference Call — 2/2/22
Ferrari Q4 Conference Call — 2/2/22
Match Group Q4 Conference Call — 2/2/22
Advanced Micro Devices Q4 Conference Call — 2/1/22
PayPal Q4 Conference Call — 2/1/22
Starbucks Q1 Conference Call — 2/1/22
Alphabet Q4 Conference Call — 2/1/22
United Parcel Service Q4 Conference Call — 2/1/22
Visa Q1 Conference Call — 1/27/22
Apple Q1 Conference Call — 1/27/22
McDonald’s Q4 Conference Call — 1/27/22
Intel Q4 Conference Call — 1/26/22
Tesla Q4 Conference Call — 1/26/22
Boeing Q4 Conference Call — 1/26/22
Automatic Data Process Q4 Conference Call — 1/26/22
Microsoft Q2 Conference Call — 1/26/22
Johnson & Johnson Q4 Conference Call — 1/25/22
3M Q4 Conference Call — 1/25/22
Lockheed Martin Q4 Conference Call — 1/25/22
American Express Q4 Conference Call — 1/25/22
Netflix Q4 Conference Call — 1/20/22
Intuitive Surgical Q4 Conference Call — 1/20/22
Union Pacific Q4 Conference Call — 1/20/22
Baker Hughes Q4 Conference Call — 1/20/22
UnitedHealth Q4 Conference Call — 1/19/21
Fastenal Q4 Conference Call — 1/19/22
Procter & Gamble Q2 Conference Call — 1/19/22
Silvergate Capital Q4 Conference Call — 1/18/22
Charles Schwab Q4 Conference Call — 1/18/22
BlackRock Q4 Conference Call — 1/14/22
JP Morgan Q4 Conference Call — 1/14/22
KB Home Q4 Conference Call — 1/12/22
Delta Airlines Q4 Conference Call — 1/13/22
Constellation Brands Q3 Conference Call — 1/6/22
Nike Q2 Conference Call — 12/20/21
Chart of the Day: After Hours vs. Intraday for Bitcoin
Six-Month Winning Streaks for Oil
Coming out of Memorial Day weekend, WTI crude oil closed out May with its sixth straight monthly gain, resulting in the second-longest streak going back to 1983. Everyone with a car has dealt with rising costs at the pump, and the AAA national average price per gallon is currently $4.67, the highest level on record. This comes as the Biden administration has halted the importation of Russian oil, and the European Union attempts to reduce its energy dependence on Russia as well. At the same time, the reopening has caused a pick-up in demand, and the gross imbalance of supply and demand has pushed up prices to nearly unprecedented levels.

Since the US government stopped price controls on US crude oil in the early 1980s, there have only been six other periods where WTI prices rose for five or more consecutive months. As you can see from the chart below, half of these occurrences were shortly after the Global Financial Crisis, as prices rebounded from the sharp downturn in prices during the financial collapse, and the most recent was in early 2018.
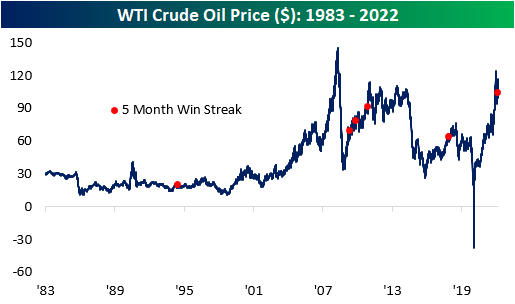
Following five consecutive months of gains in oil, the average performance has been relatively weak compared to historical averages. In the first five months of each streak, oil prices have rallied by an average of 40.9% (median: 38.6%), which is nearly ten times higher than the average of all five-month periods since 1983. However, oil tends to underperform in the near term following these occurrences, registering an average loss of 3.2% and 0.8% over the next week and month, respectively. Notably, this was the only occurrence in which the price of oil climbed higher in both the following week and month, gaining 4.9% and 9.5% respectively. The only period in which the average performance was higher than that of all periods is three months, as oil has averaged a gain of 4.4% after a streak of five months is reached.

The chart below summarizes the performance one year before and after a streak of five months is reached. As you can see, oil has traded most similarly to the late 2009 occurrence, in which the price of oil rose by 15.1% in the following year. Long story short, although the average performance in these time periods is relatively weak, there isn’t a clear trend in performance in one direction or the other. Click here to become a Bespoke premium member today!

Biggest Energy Names See Record Moves
The Energy sector has been on an absolute tear over the pandemic period with a 273% gain since the pandemic lows in March 2020. During the overall market downturn of the past several months, it is the only cyclical sector to have managed to retain its uptrend as it has rallied over 60% year to date compared to a 13% decline for the S&P 500. Taking a look through our Chart Scanner tool, there is not too much variation in the charts of large-cap Energy stocks with strong uptrends across the board and many new multi-year highs as a result. Taking a look at two of the largest members who account for nearly three-quarters of a trillion dollars in market cap, Exxon Mobil (XOM) and Chevron (CVX) are good examples. CVX has reached new all-time highs following its meteoric rise over the past couple of years while XOM has recovered most of the past decade’s declines. Additionally, we would note that XOM has historically tended to be much larger than CVX, but the pandemic and the subsequent rally over the past couple of years have brought the two stocks’ market caps much more closely in line with one another.
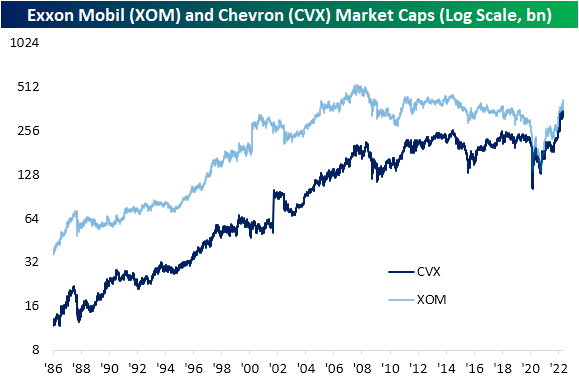
Both long-standing staples of the Energy sector, XOM and CVX are also notable in that they are both dividend aristocrats (a group of stocks that have now raised their dividend annually for 25 or more consecutive years). That means on top of massive capital gains, investors have also been rewarded handsomely with dividends. Even after these massive rallies, CVX still yields 3.25% and XOM pays an even better 3.67%. Taking this into account, the two-year runs including dividends that these stocks have been on are unlike anything observed since at least the early 1980s. Given the record two-year run we’ve seen in the Energy space, it’s tough to get super bullish on this area of the market now. Remember, we saw an explosive move higher like this for other areas of the market earlier on in the post-pandemic era (think meme stocks, SPACs, high growth, etc.), but once the tide turned in late 2021, the downside reversal was just as extreme. Energy stocks have completely different fundamental risk profiles than aggressively valued Tech stocks, and ultimately their performance is mostly tied to the price of oil. That being said, investor psychology and herd mentality work the same regardless of the asset class. Click here to learn more about Bespoke’s premium stock market research service.

Bespoke’s Morning Lineup – 6/1/22 – QT Begins
See what’s driving market performance around the world in today’s Morning Lineup. Bespoke’s Morning Lineup is the best way to start your trading day. Read it now by starting a two-week trial to Bespoke Premium. CLICK HERE to learn more and start your trial.
“Often we look so long at the closed door that we do not see the one which has been opened for us.” – Helen Keller

Below is a snippet of content from today’s Morning Lineup for Bespoke Premium members. Start a two-week trial to Bespoke Premium now to access the full report.
It’s a new month and markets are looking to start off on a good note with equity futures modestly higher across the board. Positive sentiment this morning has been driven by earnings from Salesforce (CRM) and Victoria’s Secret (VSCO). In economic data, German Retail Sales came in weaker than expected for the month of April, and PMI data for the month of May in both Asia and Europe generally showed a slowing but still growing trend.
Looking ahead here in the US, Construction Spending (April), ISM Manufacturing (May), and JOLTS (April) will all be released at 10 AM.
In today’s Morning Lineup, we discuss recent trends in the natural gas market (pg 4), activity in Asian and European markets (pg 4), May PMI trends from around the world (pg 5), and then selected economic data from Asia and Europe (pg 6).
We’ve noted the wide divergence in performance between individual sectors this year, but within the commodity space, the discrepancies are even wider. As shown in the snapshot of our Trend Analyzer below, the spread in YTD performance among commodity-related ETFs through the end of May is over 130 percentage points! At the top of the list, the US Natural Gas Fund (UNG) has rallied more than 123% even after falling more than 7% over the last five trading days. Behind UNG, the next best performing ETFs are also energy-related but they’re up less than half as much as UNG. At the other end of the spectrum, precious metals have been the worst performers YTD as Silver (SLV) is down nearly 8%, while gold-related ETFs are barely hanging on to gains. That may not sound like much, but compared to equities, which are down by double-digit percentages this year, flat is 2022’s version of up.

Start a two-week trial to Bespoke Premium to read today’s full Morning Lineup.