Bespoke Baskets Update – November 2025
Chart of the Day – Mega-Cap Fade
October 2025 Headlines
B.I.G. Tips – Big Drawdowns
Bespoke’s Morning Lineup – 11/19/25 – Waiting
See what’s driving market performance around the world in today’s Morning Lineup. Bespoke’s Morning Lineup is the best way to start your trading day. Read it now by starting a two-week trial to Bespoke Premium. CLICK HERE to learn more and start your trial.
“What we anticipate seldom occurs, what we least expected generally happens.” – Benjamin Disraeli

Below is a snippet of commentary from today’s Morning Lineup. Start a two-week trial to Bespoke Premium to view the full report.
After rallying off the morning lows yesterday, the major averages rallied back near the unchanged line but then drifted lower in the final hour of trading. This morning, equity futures are fractionally higher, while the 10-year yield is unchanged. Crude oil is sharply lower with a decline of 2.7% down to $59 per barrel on reports that the US and Russia may be near an agreement to end the war in Ukraine. Lower oil prices should be a welcome signal for anyone worried about inflation.
In Asia overnight, it was a mixed session with no major index up or down 1%, so maybe we’re starting to see some stabilization following a couple of days of weakness. It was a similar picture in Europe, as the STOXX 600 is up 0.1% and no major country benchmark is up or down 0.5%. Eurozone CPI increased 0.2% m/m in October, which was slightly higher than the 0.1% forecast, but core CPI was right in line with expectations, rising 0.3%.
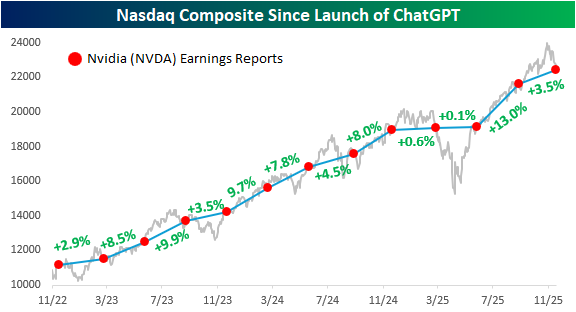
Tom Petty said, “waiting is the hardest part,” and the market and investors can’t wait for Nvidia (NVDA) earnings after the close in hopes that it will help to get the market rally back on track. While results are widely expected to be good, if not great, the stock’s reaction will say a lot about the market’s posture heading into year-end.
The chart below from yesterday’s Chart of the Day shows the performance of Nasdaq since the launch of ChatGPT, and each red dot indicates days when Nvidia (NVDA) reported earnings. The label between each pair of dots shows how the S&P 500 performed in that span. What’s amazing about the last three years is that in every period between NVDA earnings reports, the Nasdaq has traded higher. That kind of consistency is extremely uncommon and won’t last forever.
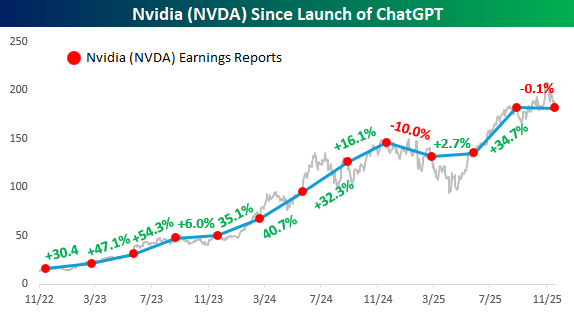
Below we show the same chart but have swapped out the Nasdaq for NVDA. While NVDA’s run has been impressive, it hasn’t traded higher between each of its earnings reports over the last three years. It fell 10% from last November to March of this year, and through yesterday’s close, it’s once again on pace for a decline, although a much more modest one than three quarters ago. If there’s one takeaway from the chart, the smooth, seemingly uninterrupted pace of gains since the launch of ChatGPT has ended.
The Closer – Jobs, CLO Quality, Credit – 11/18/25
Log-in here if you’re a member with access to the Closer.
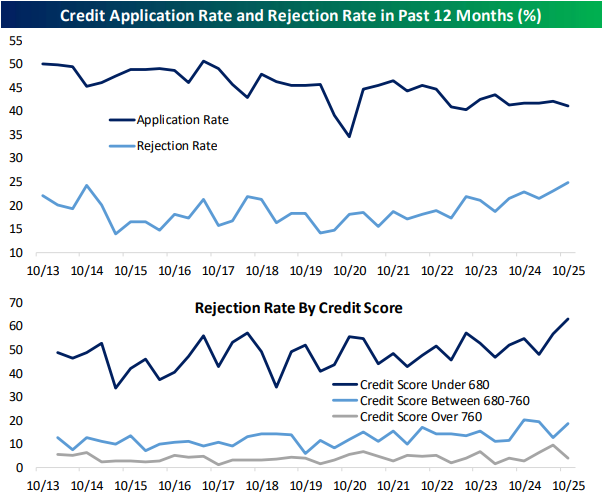
Looking for deeper insight into markets? In tonight’s Closer sent to Bespoke Institutional clients, we begin with a look into how jobs data is shaping up (page 1) followed by a look into collateralized loan obligations (page 2), auto ABS, and office CMBS (page 3). Next up, we dive into credit card delinquencies (page 4) and New York Fed consumer credit data (pages 5 and 6).
See today’s full post-market Closer and everything else Bespoke publishes by starting a 14-day trial to Bespoke Institutional today!
Daily Sector Snapshot — 11/18/25
Chart of the Day – Nasdaq 5% Declines
Bespoke’s Morning Lineup – 11/18/25 – Vibe Shift
See what’s driving market performance around the world in today’s Morning Lineup. Bespoke’s Morning Lineup is the best way to start your trading day. Read it now by starting a two-week trial to Bespoke Premium. CLICK HERE to learn more and start your trial.
“Bitcoin is like anything else: it’s worth what people are willing to pay for it.” – Stanley Druckenmiller
Below is a snippet of commentary from today’s Morning Lineup. Start a two-week trial to Bespoke Premium to view the full report.
In the world of spreadsheets, any financial model can tell you with precision what a stock or asset should be worth, but in the real world, just as the S&P 500 rarely has an ‘average’ annual return, stocks and other assets rarely trade at the price where they should trade. It doesn’t take long in the market to learn that sentiment is often just as important as fundamentals, and the last few weeks show that sentiment about what things are worth in many areas of the financial market has been shifting.
S&P 500 and Nasdaq futures are down about 0.5% with the Dow slightly weaker as a 3.4% decline in Home Depot (HD) following earnings drags on that index. The risk-off sentiment has treasury yields moving modestly lower, with the 10-year yield down to 4.10%. Crude oil is little changed but below $60 per barrel, gold is down over 1%, and Bitcoin is modestly lower after briefly breaking below $90,000 overnight (more on that below).
Asian stocks traded sharply lower in the aftermath of selling in the US yesterday. Japan and South Korea both fell over 3%, while Hong Kong was down closer to 2%, and China got off ‘easy’ with a fall of just 0.8%. The declines in Japan’s Nikkei and South Korea’s KOSPI now have those indices down over 6% from their respective highs, but Japan is still up over 22% YTD and South Korea is up over 60%, so they’re still handily outperforming the S&P 500.
Europe is also taking a defensive tone this morning as major indices in the region are all down between 1% and 2%. There’s been no real catalyst behind the move besides the overall risk-off tone across global markets.
What people are willing to pay for Bitcoin today is a lot lower now than it was six weeks ago. After hitting record highs in early October, Bitcoin prices have been in free-fall, dropping more than 27% from their highs and to their lowest level since the tariff-tantrum in April. From a technical perspective, the 50-DMA has now crossed down through the 200-DMA, indicating a shift in the trend for crypto.
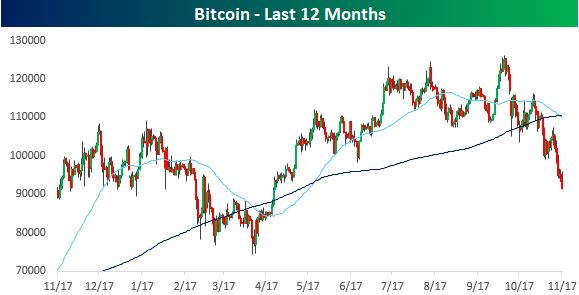
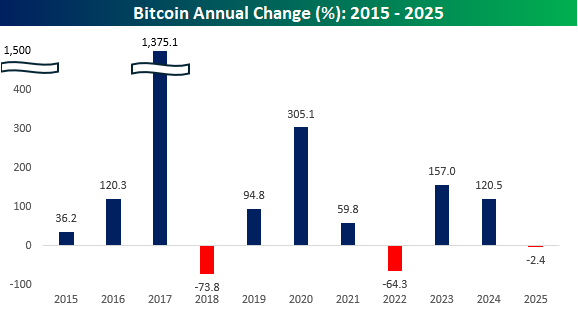
More notable about the recent weakness is that prices are now on pace for just the third down year since 2015. It’s been a painful six weeks, but if there’s any consolation, “HODLers” can take some comfort that this year’s decline is nowhere nearly as steep as the 64.3% decline in 2022 and the 73.8% decline in 2018.
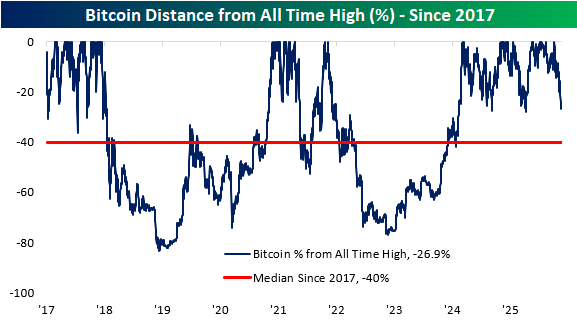
With a decline of around 27% from its recent high, Bitcoin’s decline has been contained, at least relatively speaking. The chart below shows Bitcoin’s historical drawdowns from record highs, and the current decline has been tame compared to the historical norms. Since 2017, on any given day, Bitcoin’s median decline from an all-time high has been 40%.
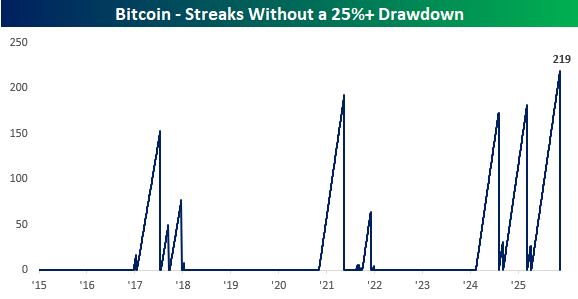
What’s notable about the recent decline is that, over the weekend, Bitcoin ended a streak of 219 days without trading in a 25% drawdown. That was the longest streak since at least 2015.
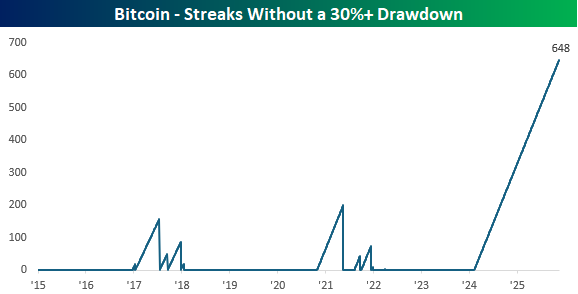
While Bitcoin’s just-ended streak without a 25% decline was historic, one could argue it’s even more overdue for a 30% decline. Through yesterday, Bitcoin has gone nearly 22 months without falling more than 30% from an all-time high, but it is getting close…
The Closer – Baskets & Bitcoin – 11/17/25
Log-in here if you’re a member with access to the Closer.
Looking for deeper insight into markets? In tonight’s Closer sent to Bespoke Institutional clients, we start with an update on major equity index technicals following today’s decline (page 1) in addition to updates on a number of baskets including those tracking momentum, unprofitable tech, private equity, travel stocks, and more (pages 2 & 3). We then review Bitcoin’s bear market (page 4) before diving into the charts of a couple hyper-scalers (page 5). After that, we provide our quarterly update of our Best of Breed Basket (pages 6 & 7). We finish with recaps of the latest economic data (pages 8 & 9).
See today’s full post-market Closer and everything else Bespoke publishes by starting a 14-day trial to Bespoke Institutional today!