Total Return vs Price Change Spreads
As we mentioned in today’s Chart of the Day, there can be a wide spread between total returns and price change based on dividend yield. Although it doesn’t always make financial sense for a company to pay dividends, they can certainly magnify returns all else equal. Click here to start a two-week trial to Bespoke Premium and receive our paid content in real-time.
The table below outlines twenty S&P 500 stocks that have seen a high percentage of their returns over the last twenty years come from dividends. The average stock on this list has seen over 80% of their gains over the last two decades come from dividends alone. Although the average stock on this list has only seen a price gain of 61.1% since August of 2002, their average total return when factoring in dividends re-invested has been 278%.

To show you what we mean, below is a chart of price change versus total return over the last 20 years for Altria Group (MO). As you can see, the dividend in this case turns a below average stock into an outperformer. Click here to start a two-week trial to Bespoke Premium and receive our paid content in real-time.

The Bespoke 50 Growth Stocks — 8/18/22
The “Bespoke 50” is a basket of noteworthy growth stocks in the Russell 3,000. To make the list, a stock must have strong earnings growth prospects along with an attractive price chart based on Bespoke’s analysis. The Bespoke 50 is updated weekly on Thursday unless otherwise noted. There were three changes to the list this week.
The Bespoke 50 is available with a Bespoke Premium subscription or a Bespoke Institutional subscription. You can learn more about our subscription offerings at our Membership Options page, or simply start a two-week trial at our sign-up page.
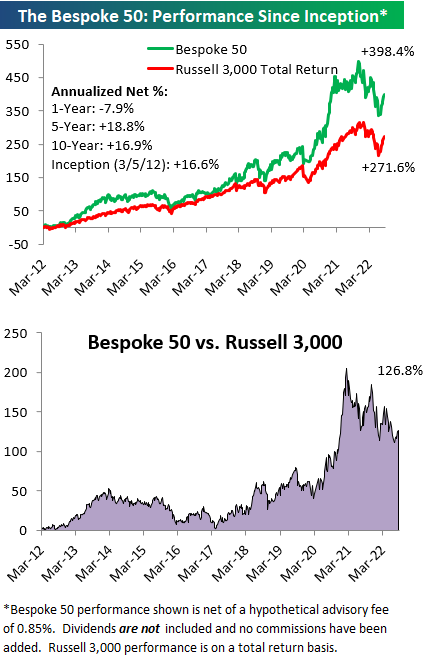
The Bespoke 50 performance chart shown does not represent actual investment results. The Bespoke 50 is updated weekly on Thursday. Performance is based on equally weighting each of the 50 stocks (2% each) and is calculated using each stock’s opening price as of Friday morning each week. Entry prices and exit prices used for stocks that are added or removed from the Bespoke 50 are based on Friday’s opening price. Any potential commissions, brokerage fees, or dividends are not included in the Bespoke 50 performance calculation, but the performance shown is net of a hypothetical annual advisory fee of 0.85%. Performance tracking for the Bespoke 50 and the Russell 3,000 total return index begins on March 5th, 2012 when the Bespoke 50 was first published. Past performance is not a guarantee of future results. The Bespoke 50 is meant to be an idea generator for investors and not a recommendation to buy or sell any specific securities. It is not personalized advice because it in no way takes into account an investor’s individual needs. As always, investors should conduct their own research when buying or selling individual securities. Click here to read our full disclosure on hypothetical performance tracking. Bespoke representatives or wealth management clients may have positions in securities discussed or mentioned in its published content.
Bespoke’s Weekly Sector Snapshot — 8/18/22
Chart of the Day: Price Change vs. Total Return
Bulls Set a New High
Bullish sentiment continued its recent run of increases according to the weekly AAII individual investor sentiment survey. Hitting 33.3% this week, bulls are at the highest level since the last week of 2021. That 2022 is nearly 2/3 complete and we still haven’t seen a bullish reading over 33.3% tells you how negative investors have been this year.

Bears also ticked up this week reaching 37.2% versus 36.7% last week. While bearish sentiment has only been below 40% for three weeks in a row, that is the longest stretch of sub-40% readings since the start of the year.

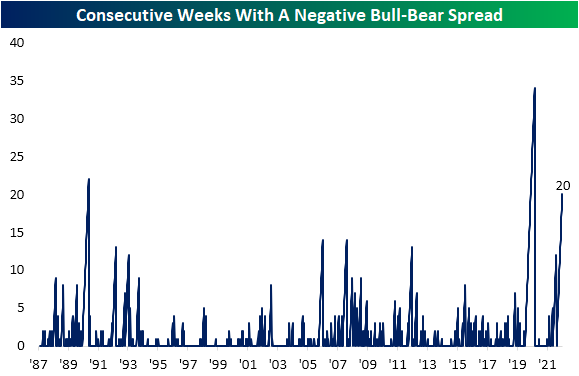
With more bears than bulls once again this week, the bull-bear spread has now been negative for 20 straight weeks.
With both bulls and bears higher, neutral sentiment was the only reading to fall this week. Neutral sentiment dropped 1.7 percentage points from 31.2% down to 29.5%. That was only the lowest reading in four weeks as neutral sentiment sits the closest to its historical average of 31.4%. Click here to learn more about Bespoke’s premium stock market research service.

Bespoke Morning Lineup — 8/18/22 — The Rise of the Utes
See what’s driving market performance around the world in today’s Morning Lineup. Bespoke’s Morning Lineup is the best way to start your trading day. Read it now by starting a two-week trial to Bespoke Premium. CLICK HERE to learn more and start your trial.
“Remember this: When you are doing nothing, those speculators who feel they must trade day in and day out, are laying the foundation for your next venture. You will reap benefits from their mistakes.” – Edwin Lefèvre, Reminiscences Of A Stock Operator

Below is a snippet of content from today’s Morning Lineup for Bespoke Premium members. Start a two-week trial to Bespoke Premium now to access the full report.
US equity futures are slightly higher ahead of the open this morning as jobless claims just came in weaker (better) than expected and Philly Fed came in stronger than expected. Outside of the 8:30 AM ET data, there’s not much else going on today.
The S&P 500’s action around resistance at its 200-DMA continues to be watched closely by traders. Yesterday’s declines continued the pullback that began late in the day on Tuesday when the index touched up against the 200-DMA in afternoon trading. To get above the 200-day at this point, the index needs to rally about 1.25% from yesterday’s close.

Our Morning Lineup keeps readers on top of earnings data, economic news, global headlines, and market internals. We’re biased (of course!), but we think it’s the best and most helpful pre-market report in existence!
Start a two-week trial to Bespoke Premium to read today’s full Morning Lineup.
Bespoke Baskets Update — August 2022
Daily Sector Snapshot — 8/17/22
Chart(s) of the Day: Breakouts
10-Day A/D Line Overbought for 15 Days
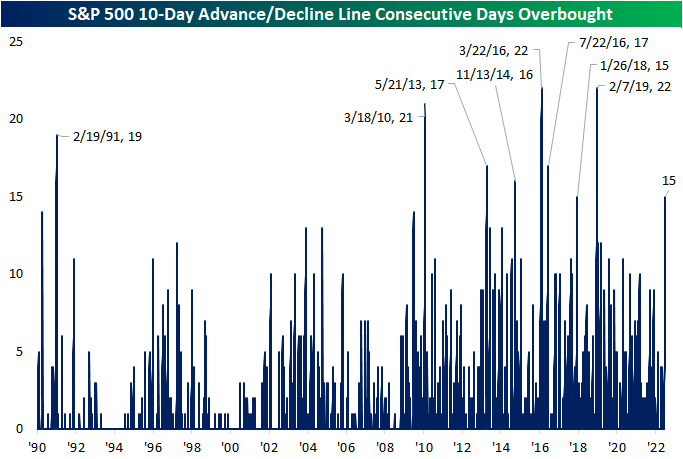
In an earlier tweet, we pointed out the elevated readings across 10-day advance decline lines in our Sector Snapshot. Not only is the 10-Day A/D line for the S&P 500 approaching one-year highs (as of yesterday’s close), but it has been “overbought” for the last 15 trading days.

Going back to the start of our data in 1990, there have only been eight other times in which the S&P 500’s 10-day A/D line has been overbought for 15 days in a row or more. The last time such a steak was observed was at the start of 2019 which ended at 22 days. That tied for the March 2016 streak for the longest on record back to 1990. We would also note that other than one streak in the first couple of months of 1991, nearly all of these long streaks with an overbought 10-day A/D line occurred since 2010. In other words, consistently impressive breadth by this measure has largely been a recent phenomenon.
This is not the only impressive breadth signal we have covered of late. For example, in yesterday’s Chart of the Day we highlighted that more than 90% of S&P 500 stocks were above their 50-DMAs. Prior times when we’ve seen that reading spike above 90% have been followed by strong returns in the months and year ahead. Looking at the past times in which the 10-day advance decline line has been overbought for 15 days in a row, forward performance of the S&P 500 has not been considerably stronger than the norm. From that 15th day, the S&P has risen half the time one week out. One and three month returns are more consistently positive but weaker than the norm on a median basis. In the year after the long overbought A/D streaks listed below, though, the S&P was higher 7 of 8 times for an average gain of 11.1%.

Below is a chart of the S&P 500 since its 2009 Financial Crisis low. As shown, most of these overbought A/D line streaks have occurred as the index was recovering from some sort of sell off. Only one of them (in early 2018) came about at the time of a notable peak in the index. Click here to learn more about Bespoke’s premium stock market research service.
