Chart of the Day – Big Rally in Small Caps
Home Price Update
Home price data from S&P Cotality for September was posted this week and showed that not one of the twenty cities tracked by Case Shiller saw a month-over-month gain. Tampa, Seattle, and San Diego saw the biggest monthly drops, while Detroit and Cleveland were down the least.
Below is a table showing home price movements over various time frames for the twenty cities tracked along with the national and composite indices.
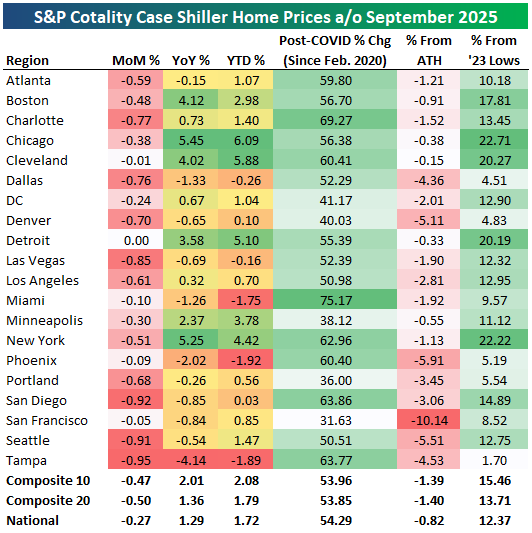
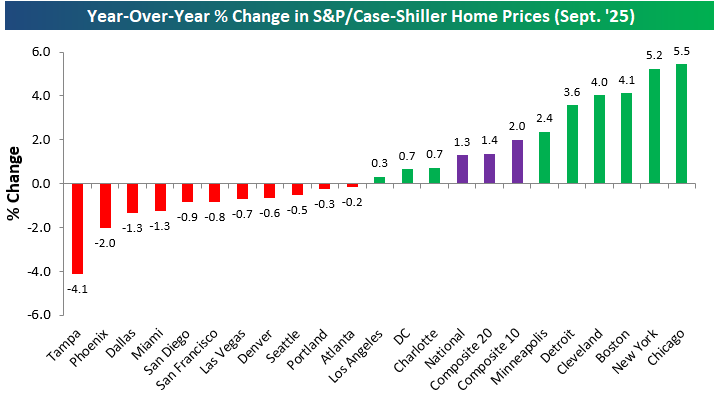
Over the last year, gains and losses are split roughly 50/50 across the country. East coast and mid-west cities like Chicago, New York, Boston, Cleveland, and Detroit are all up 4%+ over the last year, while home prices in Tampa, Phoenix, Dallas, and Miami are down the most with drops of more than 1%.
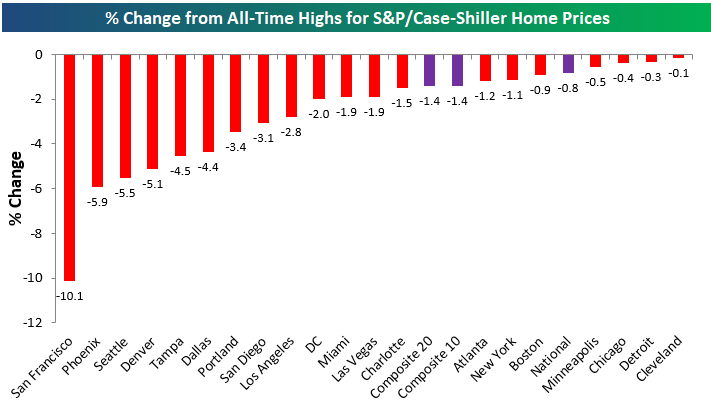
A year or so ago, nearly every city tracked by Case Shiller was sitting at record highs, but now there’s not one city that hasn’t seen at least a small drop from all-time highs.
As shown below, San Francisco home prices are in the biggest drawdown at -10.1%, followed by Phoenix (-5.9%), Seattle (-5.5%), and Denver (-5.1%).
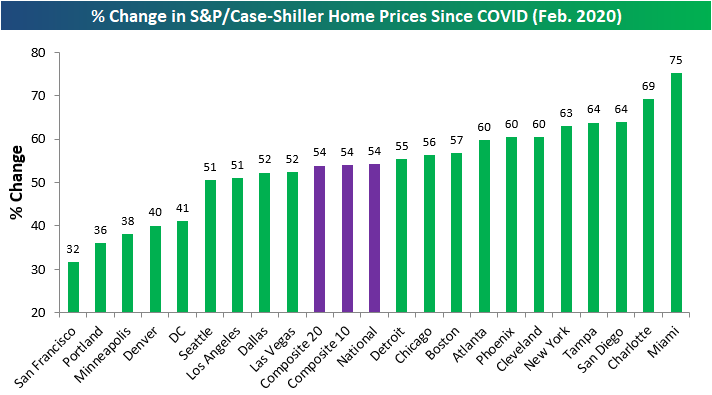
While prices have begun to dip a bit, they’re still up massively since February 2020 just before COVID hit. The composite indices tracking the entire country are still up more than 50% since COVID, while Miami, Charlotte, San Diego, Tampa, and New York are up the most at more than 60%.
The cities where home prices are up the least versus February 2020 levels are San Francisco, Portland, Minneapolis, Denver, and DC, but even these cities are still up more than 30%.
Not a Bespoke client? We’d love for you to give our equity research platform, Bespoke Premium, a try. You can sign up for complimentary access for 14 days at this link to start receiving our daily emails today!

Investors Thankful For…
Amid the ups and downs of the past year including the “tariff crash” in April, the US stock market has still posted a double-digit total return since last Thanksgiving.
Below is a look at the performance of various asset classes since the close before last Thanksgiving using key ETFs traded on US exchanges.
The Tech-heavy Nasdaq 100 (QQQ) and S&P 500 Growth (IVW) have been the best performers of the domestic index ETFs shown with gains of more than 20%.
On the flip side, mid-caps (IJH, IJJ, IJS, IJK) and small-caps (IWM, IJT, IJS) have been either flat or down over the last year.
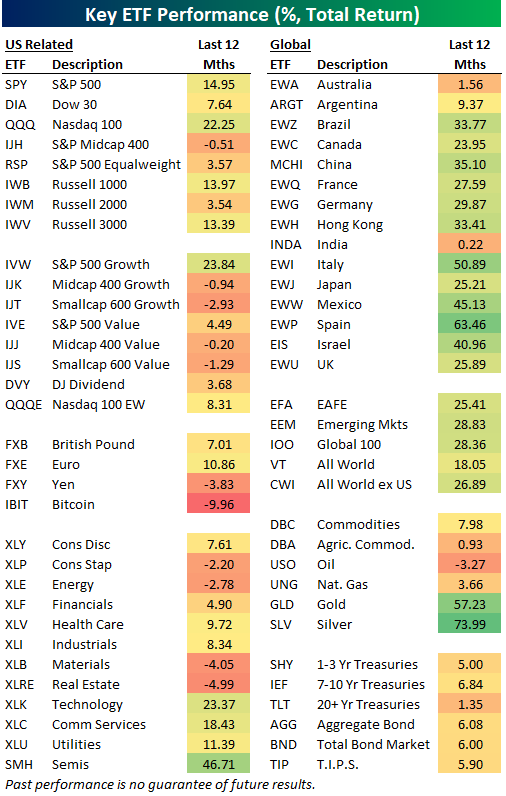
Looking at US sector ETFs, there has been quite a bit of divergence, with Consumer Staples (XLP), Energy (XLE), Materials (XLB), and Real Estate (XLRE) all in the red since last Thanksgiving, while Technology (XLK), Communication Services (XLC), and Utilities (XLU) are all up 10%+.
Aside from Australia (EWA), Argentina (ARGT), and India (INDA), the country ETFs listed in our matrix are all up 20%+ over the last year, so investors that decided to gain more exposure outside of the US have a lot to be thankful for.
The same goes for investors long the gold (GLD) and silver (SLV) ETFs. These two precious metal ETFs are up the most in our entire matrix!
On the flip side, the iShares Bitcoin ETF (IBIT) has been the worst performer in the matrix since last Thanksgiving with a decline of 9.96%. Just a month or so ago, IBIT owners had a lot to be thankful for, but after a 30% drawdown from highs, now it’s “not so much.”
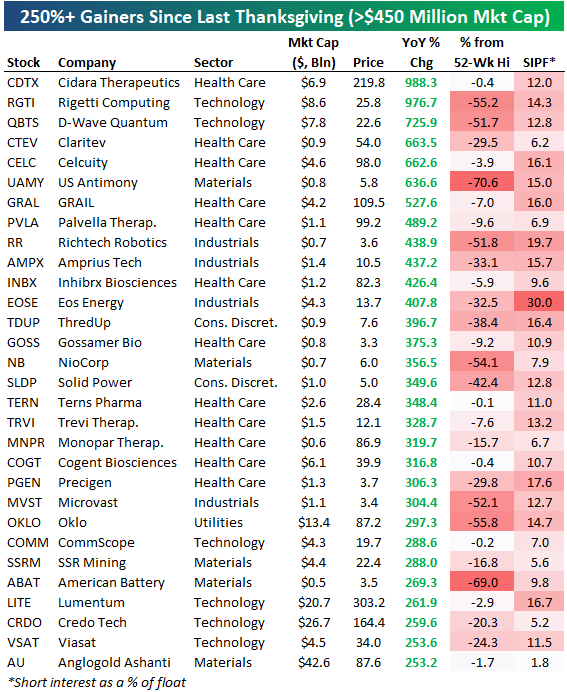
Speaking of being thankful, anyone that managed to go long the names below a year ago should probably be offering to pay for this year’s Thanksgiving turkey.
The stocks shown are Russell 3,000 names that are up more than 250% since last Thanksgiving, of which there are thirty.
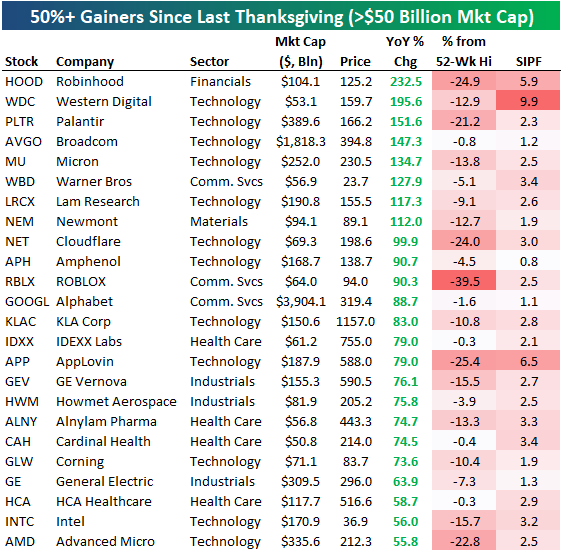
If you’re just interested in the largest, most well-known stocks, below is a list of names with market caps of $50+ billion that have done the best over the last year. There are eight that have doubled: Robinhood (HOOD), Western Digital (WDC), Palantir (PLTR), Broadcom (AVGO), Micron (MU), Warner Bros. (WBD), Lam Research (LRCX), and Newmont (NEM).
Not a Bespoke client? We’d love for you to give our equity research platform, Bespoke Premium, a try. You can sign up for complimentary access for 14 days at this link to start receiving our daily emails today!
Health Care’s Epic Rally
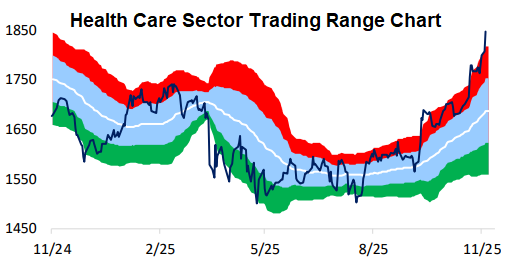
As the Tech/AI trade has hit a speed bump this month, the Health Care sector has been shot out of a cannon. At yesterday’s close, the S&P 500 Health Care sector was 10% above its 50-day moving average and 2.5 standard deviations above its 50-DMA. Check out the one-year trading range chart of the sector below:
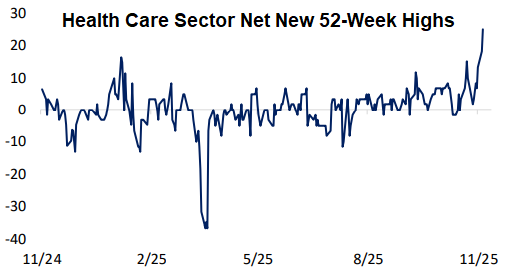
Health Care’s move in the last month has left a good chunk of the stocks in the sector at new 52-week highs. Net new 52-week highs for the sector have exploded to the highest level of the last year:
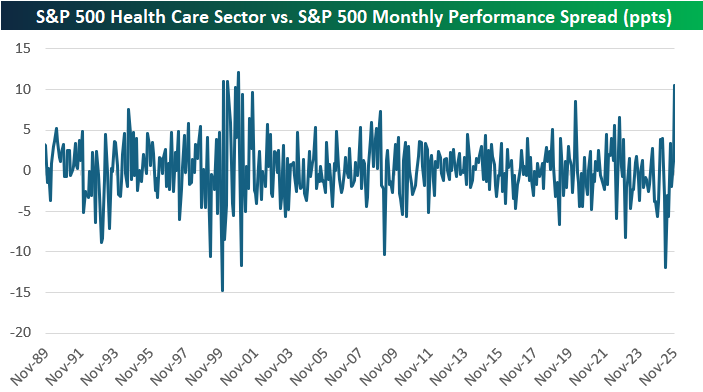
So far this month, the Health Care sector is outperforming the broad S&P 500 by more than ten percentage points. As shown below, that hasn’t happened since November 2000!
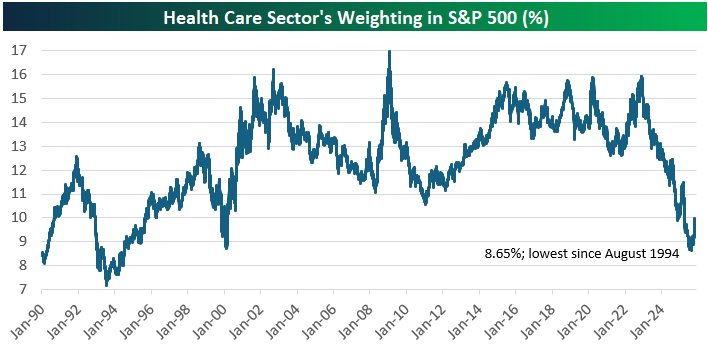
While Health Care is catching a bid these days, it’s still deep in the hole based on its action over the last couple of years. Just over two years ago, Health Care’s weighting in the S&P 500 was at 16%. By this September, its weighting had nearly been cut in half down to just 8.65%; its lowest weighting since August 1994.
Health Care’s 18% gain in the last two months has only pushed its weight in the S&P back up to 10% as of today, so there’s plenty of runway left for the sector if the good vibes continue.
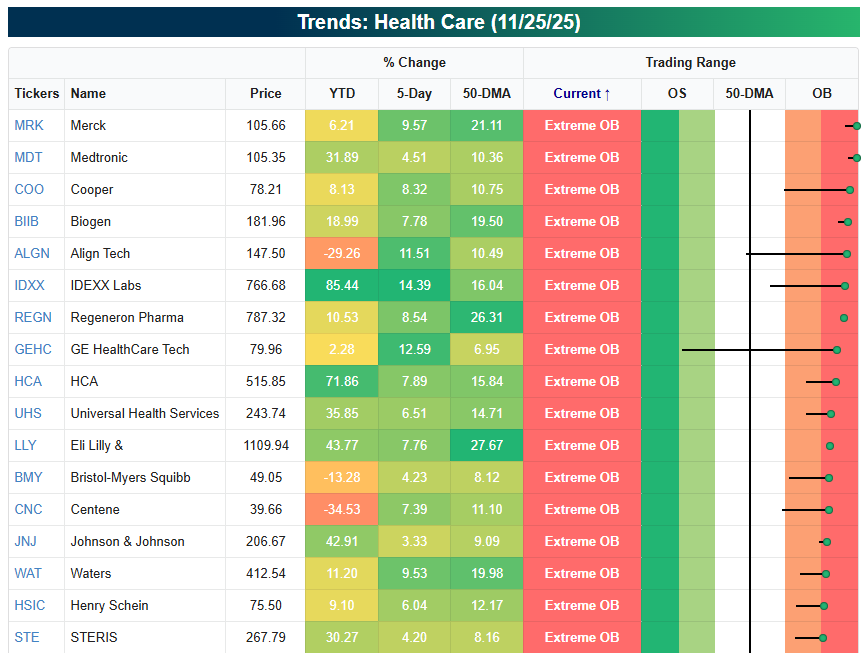
Below is a look at the most extreme overbought stocks in the sector right now. Even names like Bristol Myers (BMY) and Johnson & Johnson (JNJ) have joined in on the rally.
Of course, after moves like this, most traders would tell you to wait for some downside mean reversion before jumping in on the long side.
Not a Bespoke client? We’d love for you to give our equity research platform, Bespoke Premium, a try. You can sign up for complimentary access for 14 days at this link to start receiving our daily emails today!
2025: The Year of Alphabet
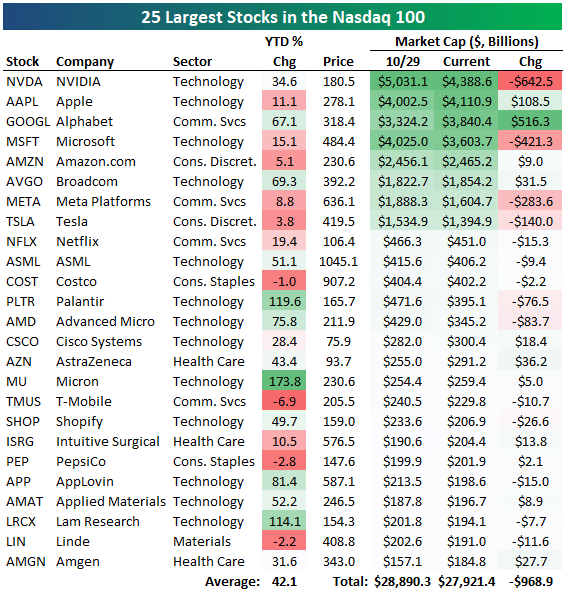
Since the Nasdaq 100 peaked on 10/29, the 25 largest stocks in the index have lost roughly $1 trillion in market cap.
Of the eight “trillion dollar companies” in the index, four have seen their market caps fall by at least $140 billion (NVDA, MSFT, META, TSLA), while the other four have actually seen their market caps increase (AAPL, GOOGL, AMZN, AVGO).
No stock has seen a bigger jump recently than Alphabet (GOOGL), whose market cap has risen by more than half of a trillion dollars since 10/29.
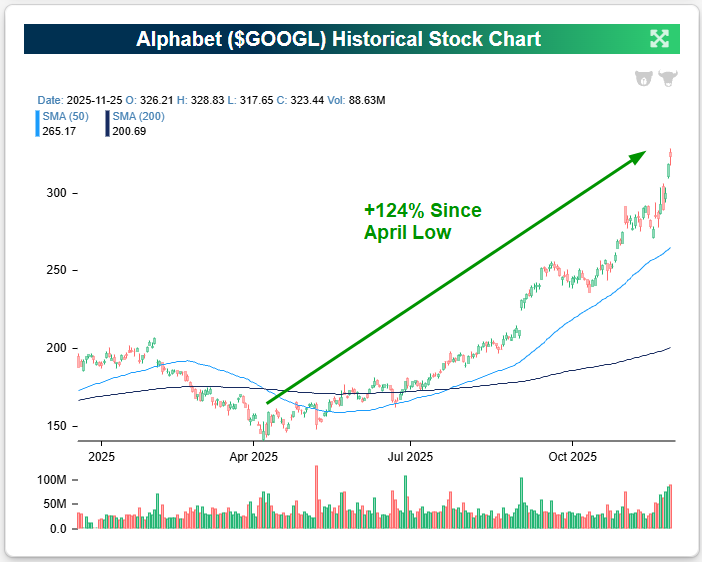
2025 has turned into the Year of Alphabet (GOOGL). It is now the best performer of the mega-caps with a 70% year-to-date gain, and it has more than doubled (+124%) since its April low. Check out the near-parabolic move that GOOGL shares have seen just in the last couple of months.
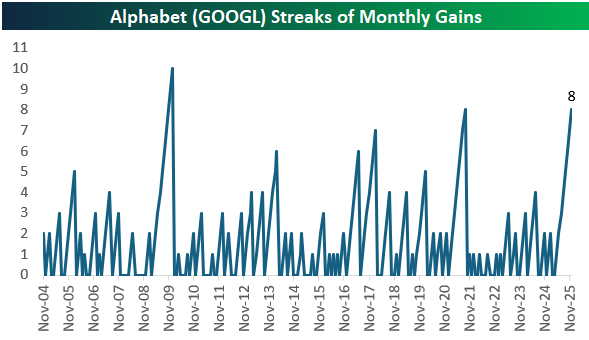
While Alphabet has recently spiked because of rave reviews for its latest LLM model (Gemini 3), GOOGL shares have actually risen for eight straight months:
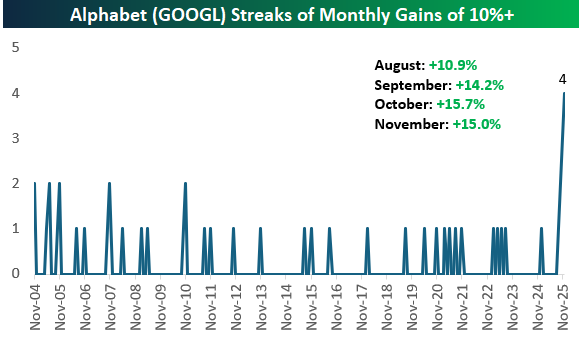
Even more remarkable is that GOOGL shares have gained more than 10% for four consecutive months, which is easily a record since it went public in 2004. (This presumes shares don’t collapse on the final trading day of November on Friday.)
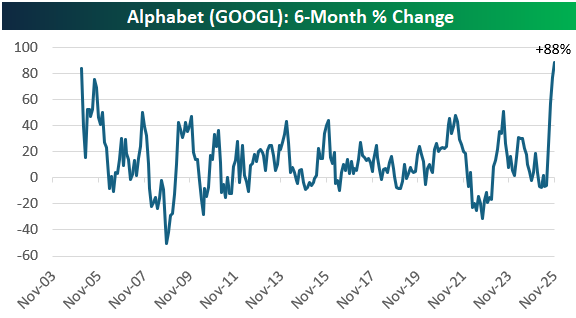
As shown below, GOOGL’s 88% gain over the last six months is its strongest six-month move in its history! An 88% move over six months is impressive for a company of any size, but it’s even more astounding for a company with a $3.8 trillion market cap.
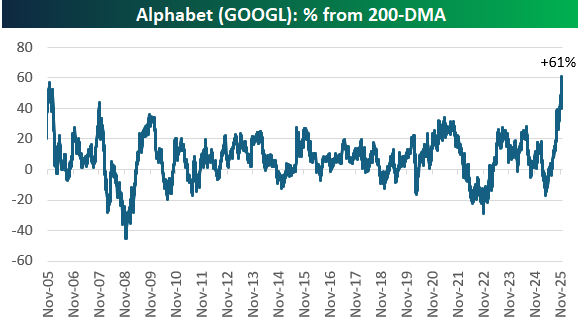
Of course, a move higher of this magnitude leaves shares extremely elevated relative to moving averages. As of yesterday, GOOGL shares were a record 61% above their 200-day moving average.
Congratulations if you’ve taken part in GOOGL’s gains this year, but most traders would say it’s too risky to take a new position in any name that gets this extended.
Not a Bespoke client? We’d love for you to give our equity research platform, Bespoke Premium, a try. You can sign up for complimentary access for 14 days at this link to start receiving our daily emails today!
Q3 2025 Earnings Conference Call Recaps: Symbotic (SYM)
Bespoke’s Conference Call Recaps use AI to summarize lengthy earnings calls. The commentary below is AI-generated and then edited by Bespoke for quality control. As always, none of these summaries should be construed as recommendations to buy or sell any securities, and investors should do their own research and/or consult with a financial professional before making any investment decisions.
Our latest recap available to Bespoke subscribers covers Symbotic’s (SYM) Q4 2025 earnings call.
![]()
Symbotic (SYM) builds automation systems that use robots, sensors, and software to move products through warehouses faster and with far fewer errors than traditional manual operations. Its bots navigate giant storage structures, retrieve items, and sequence them for shipping, helping major retailers like Walmart, wholesalers, grocers, and now healthcare distributors handle huge volumes of goods with more speed and less labor. Symbotic finished the year with $618M in quarterly revenue, up 10%, as more automated systems went live and software and service fees climbed. The biggest news was its first healthcare win with Medline, opening the door to a massive new market of 500+ US distribution centers. Its new “next-gen” storage setup is cutting installation time in half for large customers by allowing what used to be two deployments to be completed in one. GreenBox, its joint venture with SoftBank that builds and operates fully automated warehouses, allowing companies to rent space and fulfillment services powered by Symbotic’s robotics instead of constructing their own distribution centers, is preparing to open its first site in Atlanta as demand grows for faster, more local e-commerce fulfillment. SYM reported EPS of -$0.03, which missed estimates, but beat on the top line as shares surged 36% on 11/25…
Continue reading our Conference Call Recap for SYM by becoming a Bespoke Institutional subscriber. You can sign up for Bespoke Institutional now and receive a 14-day trial to read our newest Conference Call Recap. To sign up, choose either the monthly or annual checkout link below:
Boomer Blues, Not Gen Z?
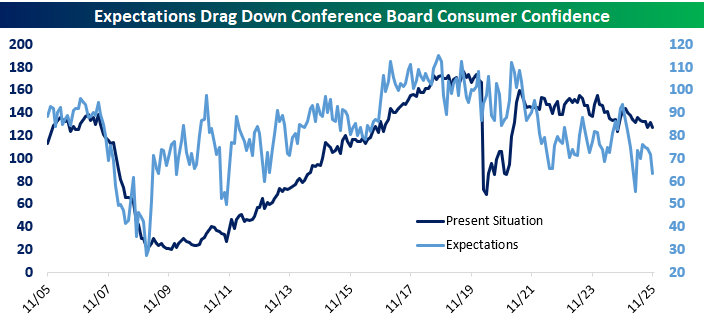
November’s consumer confidence data from The Conference Board, released yesterday, continued its downward trend, with both Present Situation and Expectations readings showing another drop.
As shown below, Present Situations has been trending lower throughout the 2020s after trending higher from the end of the Financial Crisis through 2018. The reading for Expectations has taken a similar path, cratering more in November to the bottom end of its 15+ year range.
Consumer confidence readings continue to look remarkably disconnected from economic fundamentals, a pattern that has persisted pretty much since the first Trump Presidency.
While political leanings have a big impact on confidence (Democrats and Independents are currently much more bearish than Republicans), we now also see age-based confidence divergences.
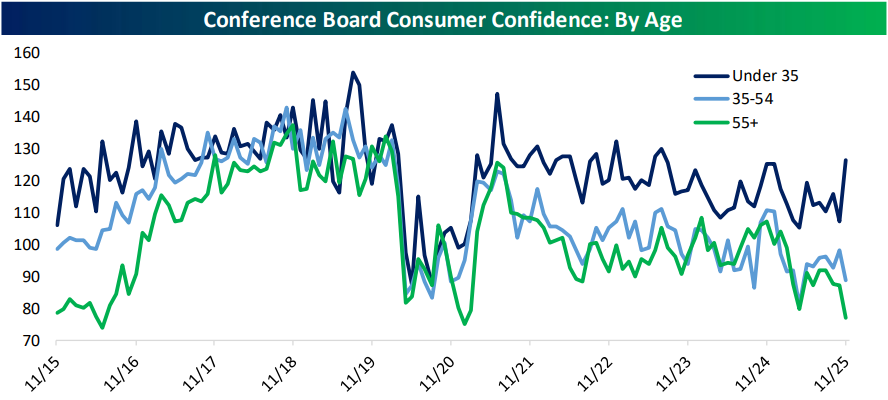
Below is a look at The Conference Board’s Consumer Confidence reading broken out by three age bands: under 35, 35 to 54, and 55+.
Counter to the recent narrative that young consumers are struggling, November Consumer Confidence among those under 35 jumped to its highest level since July 2023, while confidence among those 55 and older hit its lowest level since January 2021 and the third-lowest reading in the last ten years. Why are boomers so down on the economy when the under-35 crowd has gotten more optimistic?

Not a Bespoke client? We’d love for you to give our equity research platform, Bespoke Premium, a try. You can sign up for complimentary access for 14 days at this link to start receiving our daily emails today!
Bespoke’s Morning Lineup – 11/26/25 – Revving Up to Neutral
See what’s driving market performance around the world in today’s Morning Lineup. Bespoke’s Morning Lineup is the best way to start your trading day. Read it now by starting a two-week trial to Bespoke Premium. CLICK HERE to learn more and start your trial.
“Stop worrying about the world ending today. It’s already tomorrow in Australia.” – Charles Schulz

Below is a snippet of commentary from today’s Morning Lineup. Start a two-week trial to Bespoke Premium to view the full report.
It’s only Wednesday, but today is the last full trading day of the week, so it feels like a Friday. Futures look poised to extend the rally from last Friday into a fourth day with S&P 500 and Nasdaq futures up 0.2% after reclaiming their 50-day moving averages yesterday. The Nasdaq’s gain comes despite another 1% decline for Nvidia (NVDA), which has hit a rough patch of news in the last few days. After yesterday’s reports that Meta (META) was looking to purchase some AI chips from Alphabet (GOOGL) to diversify from NVDA, this morning, The Information is reporting that China continues to move away from NVDA chips, with the latest example being a government order blocking ByteDance from using NVDA chips in its datacenters.
Since markets are closed tomorrow, weekly jobless claims came out early this week, so after weeks of delayed reports, now we’re getting an early report! The early news was also good as both initial and continuing claims came in lower than forecast. Durable Goods and Cap Goods orders were also released and came in better than expected. Along with these reports, the Chicago PMI report for November comes out at 9:45.
Outside of equities, treasury yields are basically flat, with the 10-year yield right at 4%. Crude oil is fractionally lower again, while gold trades marginally higher, and bitcoin is lower.
Asian markets finished the mid-week session mostly higher. The lone exception was China’s Shanghai Composite, which saw a modest decline. South Korea led the region higher with a gain of 2.7% while Japan finished up 1.9%. European markets are mostly higher, with the STOXX 600 up 0.4%, but Germany is underperforming after the IMF says that the economy is likely to undershoot growth expectations given its current trajectory.
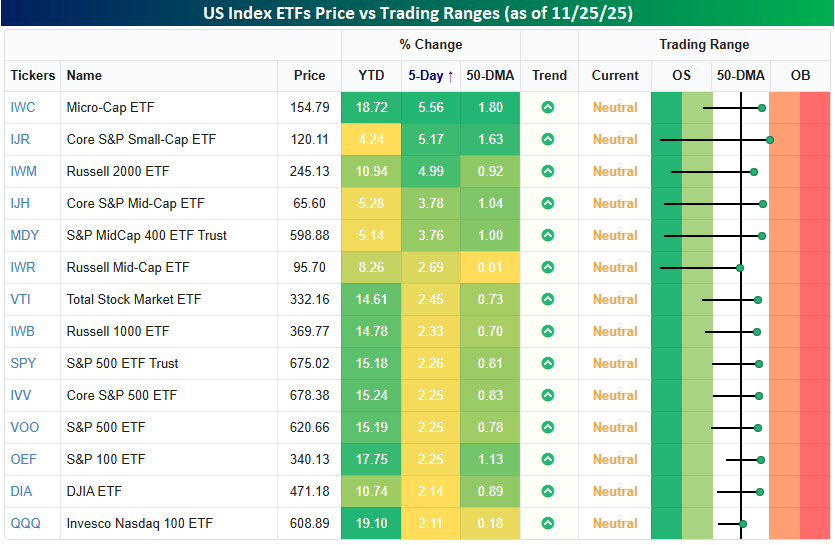
Whenever we hear the term “neutral,” we associate it with the word stuck giving it a negative connotation. There’s nothing negative about the neutral state of the major US equity indices, though, since it follows what were mostly oversold conditions last week at this time. As shown in the snapshot below, a week ago, all the index ETFs in our Trend Analyzer snapshot were below their 50-day moving averages, and most of them were oversold. As of yesterday’s close, none of them were oversold, and all of them were above their 50-DMAs. We’ll take neutral!
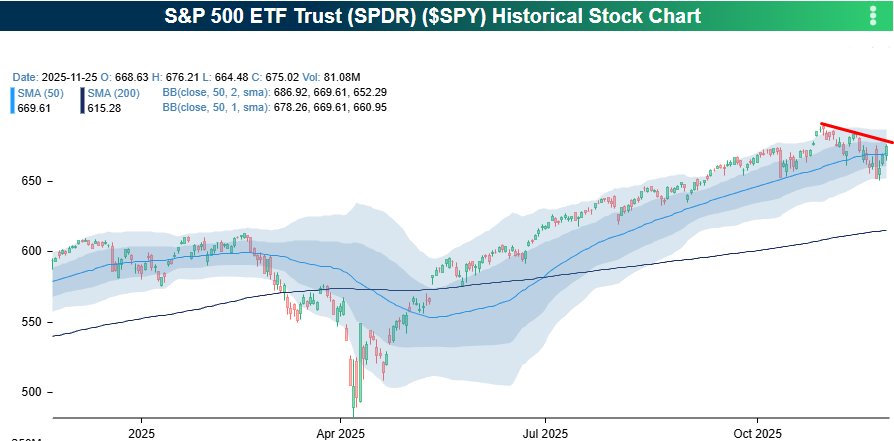
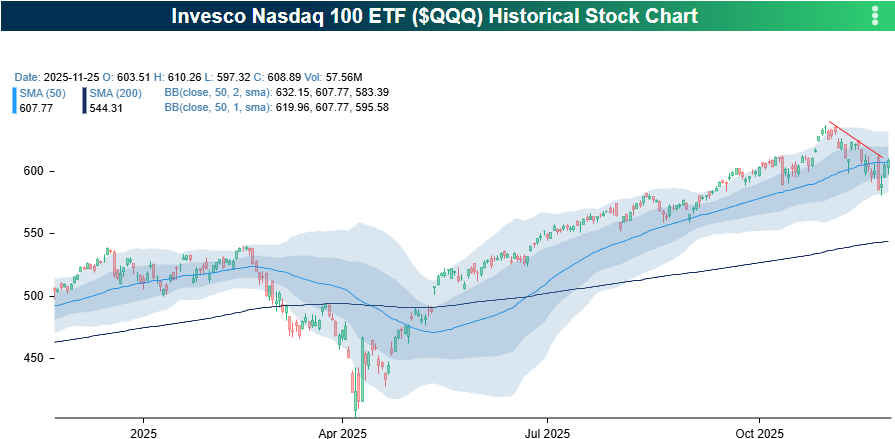
While bulls have welcomed the rebound in US equities, large-cap stocks still have more work to do before breaking the short-term downtrends that have been in place since the October highs. As shown in the two charts below, the S&P 500 ETF closed yesterday just below that downtrend line, while QQQ tested that downtrend yesterday and even peeked above it, depending on how hard you squint.
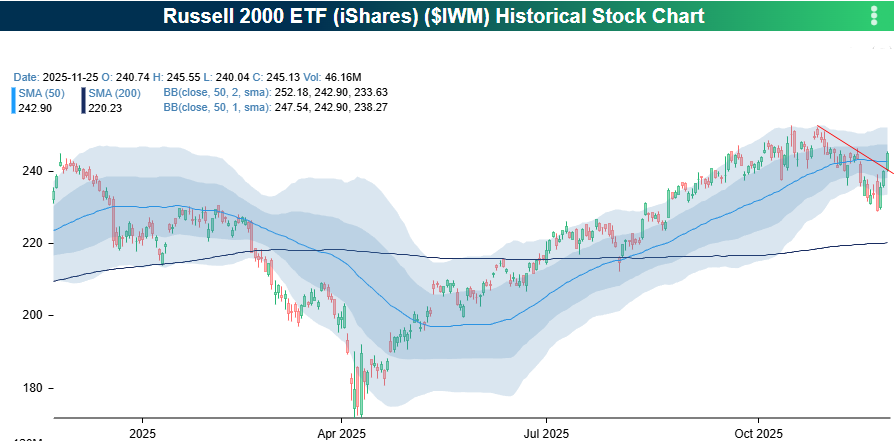
As the snapshot above illustrates, small-cap stocks have led the rally over the last five trading days with gains of about 5% compared to gains of about half that for their large-cap peers. With that outperformance, the Russell 2000 broke its downtrend from the October highs. Is this the long-awaited broadening we’ve all been waiting for?
The Closer – Data Deluge, Sunbelt Housing – 11/25/25
Log-in here if you’re a member with access to the Closer.
Looking for deeper insight into markets? In tonight’s Closer sent to Bespoke Institutional clients, we review a huge day for (mostly delayed) US data including the weekly ADP payrolls estimate (page 1), retail sales (page 1), PPI (page 2), Conference Board consumer confidence (page 3), and S&P Cotality Case-Shiller Home Prices (page 4). We also dive into what’s driving weak home prices in the Sunbelt (page 5).
See today’s full post-market Closer and everything else Bespoke publishes by starting a 14-day trial to Bespoke Institutional today!