Bespoke’s Morning Lineup – 7/20/26 – Licking Their Wounds.
See what’s driving market performance around the world in today’s Morning Lineup. Bespoke’s Morning Lineup is the best way to start your trading day. Read it now by starting a two-week trial to Bespoke Premium. CLICK HERE to learn more and start your trial.
“If trouble comes when you least expect it then maybe the thing to do is to always expect it.” – Cormac McCarthy

Below is a snippet of commentary from today’s Morning Lineup. Start a two-week trial to Bespoke Premium to view the full report.
Markets are looking to get back on track this morning after some turbulence last week. S&P 500 futures are up 0.35% while the Nasdaq is up 0.80%, and both have been picking up steam all morning. Reports that Iran wants to come back to the negotiating table and revive the MoU have added to the positive tone.
Treasury yields are also higher this morning as the 10-year is up 3 bps to 4.57% while crude oil is fractionally lower but still above $80 per barrel. Gold is little changed, and Bitcoin is modestly higher as it looks to get back above $65K.
Asian stocks were mixed to start the week. Japan was closed for a holiday, and South Korea fell more than 4%, but that was mostly catch-up from weakness in the markets on Friday when that market was closed. In pre-market trading here in the US, memory stocks, which South Korea is basically a proxy for these days, are all trading firmly higher. Chinese stocks moved in the other direction as the Shanghai Composite rallied 0.9% and Hong Kong jumped 2.4% on reports that state-owned funds were supporting the market.
In Europe, it’s been a quiet session to start the week. The STOXX 600 was little changed, and no major benchmark index is up or down more than 0.5%. German PPI fell 0.3% versus expectations for a decline of 0.2%, and the y/y reading was just 1.8%
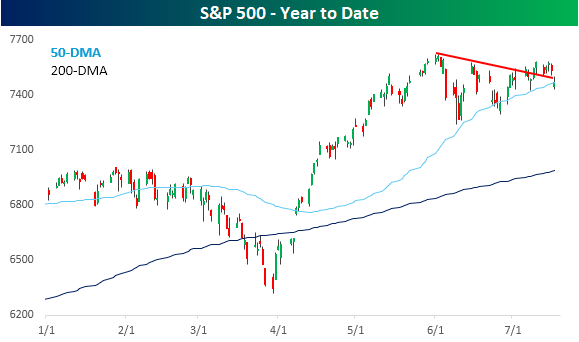
What a difference a week makes. Heading into the weekend before last, the S&P 500 wasn’t at an all-time high, but it closed at its highest level since early June after having just successfully tested its 50-DMA for the third time since its peak. With that high, the S&P 500 had also broken its short-term downtrend that had been in place since the bull market peak. Bulls were starting to get more confident.
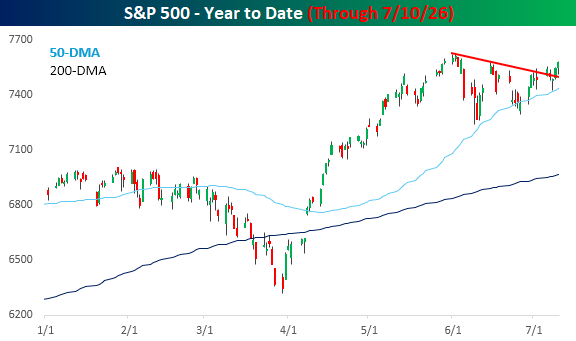
A week later, the picture didn’t look nearly as promising. In the five trading days last week, the S&P 500 never really traded above those levels from 7/10, and by Friday’s close, it was back below its downtrend line from the peak. Not only that, but the S&P 500 also closed below the 50-DMA and made a lower low relative to the intraday low in early July.
Start a two-week trial to Bespoke Premium to continue reading today’s full Morning Lineup.
Brunch Reads – 7/19/26
Welcome to Bespoke Brunch Reads — a linkfest of some of our favorite articles over the past week. The links are mostly market-related, but there are some other interesting subjects covered as well. We hope you enjoy the food for thought as a supplement to the research we provide you during the week.
The Midnight Snack: On July 19, 1941, Tom and Jerry appeared under their familiar names for the first time in a cartoon episode called The Midnight Snack. The cat-and-mouse pair had debuted a year earlier in Puss Gets the Boot, but Tom was then called Jasper, and the mouse was known behind the scenes as Jinx. After that short earned an Academy Award nomination and persuaded MGM to continue the idea, a studio contest produced the names Tom and Jerry.
In The Midnight Snack, Jerry raids the refrigerator and carries off a large piece of cheese, while Tom tries to catch him without waking the household. Their struggle quickly turns into a kitchen-wide mess, with Tom ultimately taking the blame for the late-night disturbance. It was that pursuit, slapstick destruction, and Jerry’s art of outsmarting Tom that would define the series.
Created by William Hanna and Joseph Barbera, Tom and Jerry became one of animation’s most recognizable rivalries, continuing through theatrical shorts, television series, specials, and feature films for generations. Their comedy also traveled unusually well across languages and cultures, giving the characters a reach that has lasted far beyond their original MGM run.
Sports
The Kids Need Umpires and Refs. Fewer People Want the Job. (WSJ)
Youth and school sports are struggling to find enough referees, leading to canceled games, overworked officials, and recruiting efforts aimed at former players, teenagers, veterans, and parents whose children have aged out of organized sports. The bigger problem is retention. More than 70% of new officials leave within three years, often because of abuse from coaches, parents, and spectators, prompting stricter conduct rules, added security, mental-health support, and even body cameras. [Link]
Continue reading our weekly Brunch Reads linkfest by logging in if you’re already a member or signing up for a trial to one of our two membership levels shown below! You can cancel at any time.

Daily Sector Snapshot — 7/17/26
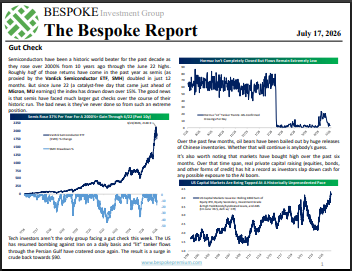
The Bespoke Report – 7/17/26 – Gut Check
To read our weekly Bespoke Report newsletter and access everything else Bespoke’s research platform offers, start a two-week trial to Bespoke Premium. In this week’s report we discuss the gut check markets are facing thanks to both geopolitics and the ongoing selloff (or is it a rotation?) in the AI trade. We review charts of key single names, valuations, historical context, and the massive capital market activity that has chased price and narrative higher. We also dive into earnings, covering reports from both US and major global names this week including a gangbusters week for Wall Street’s own earnings. The Fed had a dynamic week, so we dive in to some very hawkish speeches…and the inflation data that made them a bit irrelevant. Other US data and a big slate of releases from China are discussed before we break down commodity market price action in detail.

Financials Stay Hot, and Extremely Overbought
As we highlighted on Wednesday, the S&P 500 Financials sector extended its overbought streak to 24 trading days and made a new all-time high as of yesterday’s close. The sector has now also risen for 6 straight days, with each close occurring in extreme overbought territory (at least 2 standard deviations above its 50-DMA). This is a rare occurrence for the sector, with just 7 winning streaks of 6 or more days in which every close was at extremely overbought levels. Before the current run, the most recent occurred in 2016.
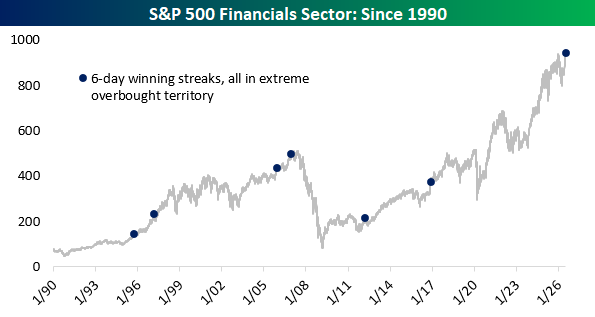
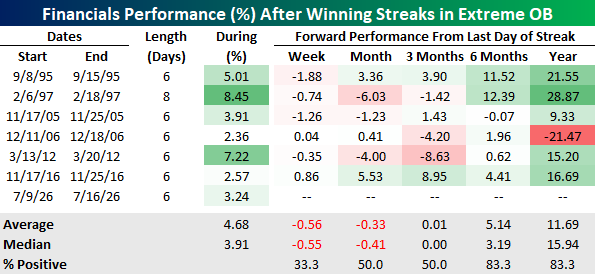
The table below lists each of the prior streaks along with how the sector performed after each streak ended.
The first such streak came in September 1995, when Financials rose for 6 straight days during a broader stretch of 18 consecutive extremely overbought closes from August 25th through September 20th. The sector remained at least one standard deviation above its 50-DMA for 47 straight trading days, from August 15th through October 19th.
In 1997, Financials closed higher for 8 days straight, all in extreme overbought territory, for the longest streak on record. During that streak, the sector rose 8.45%, the best ever performance during one of these winning streaks in extreme overbought territory.
After these streaks break, performance over the short run has historically been weak. Zooming out, though, after a year, returns have been overwhelmingly positive except for the occurrence in December 2006, leading up to the Great Recession.
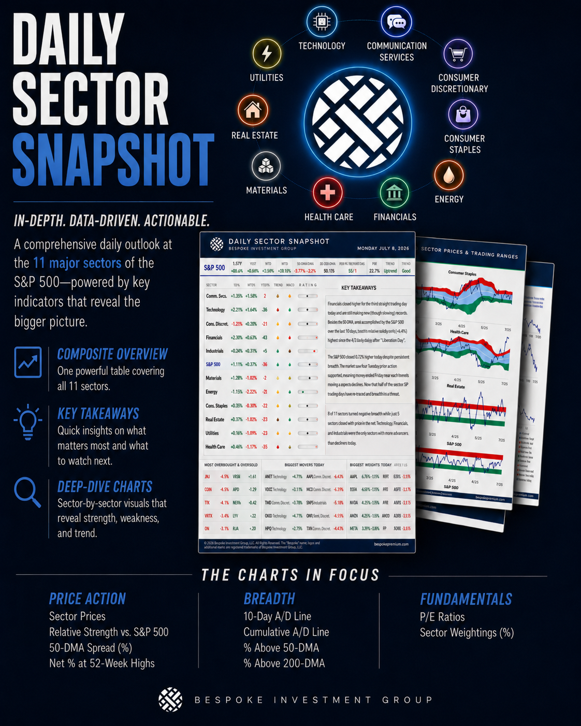
You can find more sector research like this in Bespoke’s Daily Sector Snapshot.
Read about Bespoke’s premium membership options to find out how to receive our Sector Snapshot in your inbox daily.
B.I.G. Tips – Nasdaq Indecision
Q2 2026 Earnings Conference Call Recaps: Netflix (NFLX)
Bespoke’s Conference Call Recaps use AI to summarize lengthy earnings calls. The commentary below is AI-generated and then edited by Bespoke for quality control. As always, none of these summaries should be construed as recommendations to buy or sell any securities, and investors should do their own research and/or consult with a financial professional before making any investment decisions.
Our latest recap available to Bespoke subscribers covers Netflix’s (NFLX) Q2 2026 earnings call.
![]()
Netflix (NFLX) is a global entertainment service and provider of television series, films, live programming, and games across numerous genres and languages. With approximately 330 million subscribing households and an audience approaching one billion people, NFLX provides investors with insight into global viewing habits, consumer price tolerance, advertising demand, content economics, and the evolving competition among traditional television, streaming, gaming, and creator-led media. NFLX expects 13%–14% revenue growth in 2026, supported by membership gains, successful price increases, and expanding advertising revenue. Management argued that engagement should be measured through quality and business impact, not simply hours watched, as live events generate disproportionate sign-ups and ad revenue despite representing only about 1% of viewing. The company is broadening the service through regional live events, video podcasts, vertical clips, cloud games, and partnerships such as TF1 in France. Cloud-game monthly active users have risen elevenfold since October, while podcasts are creating incremental daytime and mobile viewing. The ad-tier monetization gap continues to narrow as Netflix expands its ad technology, demand sources, products, and measurement capabilities. Generative AI has now been used across roughly 300 titles, improving production speed, cost, and creative scope, with savings expected to be reinvested into programming. NFLX reported better-than-expected EPS on weaker revenue. Shares opened 12.2% lower on 7/17 after reporting a weaker growth outlook than expected…
Continue reading our Conference Call Recap for NFLX by becoming a Bespoke Institutional subscriber. You can sign up for Bespoke Institutional now and receive a 14-day trial to read our newest Conference Call Recap. To sign up, choose either the monthly or annual checkout link below:
Bespoke’s Morning Lineup – 7/17/26 – Make Up Your Mind, Already
See what’s driving market performance around the world in today’s Morning Lineup. Bespoke’s Morning Lineup is the best way to start your trading day. Read it now by starting a two-week trial to Bespoke Premium. CLICK HERE to learn more and start your trial.
“It always seems impossible until it’s done.” – Nelson Mandela
Bespoke’s Paul Hickey will be appearing on Making Money With Charles Payne today at 2 PM on Fox Business. Check it out!
Below is a snippet of commentary from today’s Morning Lineup. Start a two-week trial to Bespoke Premium to view the full report.
It’s not looking like a good end to the week for US equity markets. S&P 500 futures are down 0.9% while the Nasdaq is down close to 2%. A new Chinese AI model from Moonshot called Kimi K3 reportedly rivals the offerings from OpenAI and Anthropic in terms of its abilities but does so using much less resources. That has the entire AI ecosystem trading sharply lower. Semiconductors are being especially hard hit as the Philadelphia Semiconductor Index (SOX) is poised to open down more than 3% and in bear market territory relative to its June highs.
Outside of equities, Treasury yields are lower with the 10-year yield down 5 bps to 4.52%. Crude oil is up over 2.5% to $81 per barrel, while gold is fractionally higher after falling below $4,000 per ounce yesterday. Bitcoin is down 1.6% but still hanging on to $63K.
It was a bloodbath in Asia last night, and it would have likely been worse had it not been for a holiday in South Korea. The Nikkei fell 4%, taking its weekly decline to 6.4% while the Shanghai Composite fell 3.1% taking its decline for the week to 5.8%. Even with South Korea being closed, the KOSPI was still down 8.8% for the week. Bucking the trend, India’s Sensex increased 1.3%, putting it 0.8% into the black for the week.
In Europe this morning, stocks aren’t feeling nearly the pain of the rest of the world, as today is one of those rare days when European investors can take comfort that its economy has little exposure to cutting-edge technology like AI. The STOXX 600 is down 0.5%, putting it into the red for the week. CPI for June fell 0.1% m/m, which was right in line with expectations.
It’s a busy day for data to close out the week. Import prices came in higher than expected, bucking the trend of weaker inflation data we saw earlier this week. Housing Starts came in significantly better than expected, but it was all centered on strength in multi-family units, while Building Permits were weaker than expected. Still on the docket later today are Industrial Production, Capacity Utilization, and Michigan Confidence.
It’s Friday night, so a lot of people probably have plans tonight. They may not know where they’re going yet, but it’s Friday, so they know they’re going somewhere. Saying you’re going out is the easy part, though. Getting everyone to agree on a time and place is a whole other story.
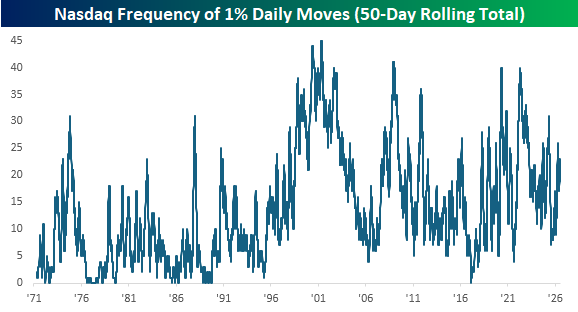
The Nasdaq is in one of those conversations now. As shown in the chart below, over the last 50 trading days, the index is up less than 1%. At the surface, you’d think that the last 2+ months have been a snoozer, but the reality has been anything but.
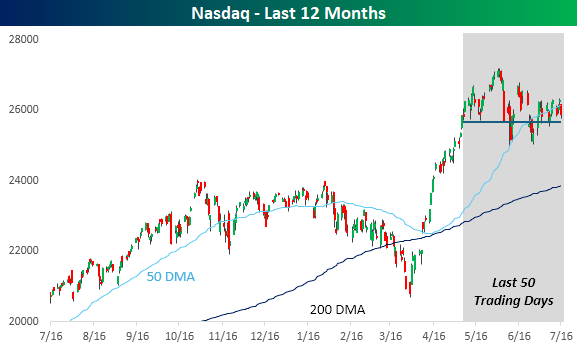
Over the last 50 trading days, the Nasdaq has moved up or down at least 1% on 23 trading days. That’s hardly extreme, but it’s still well above the long-term average of 13.
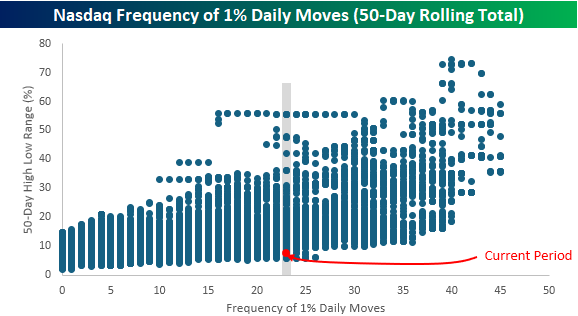
What makes the frequency of 1% days over the last 50 trading days notable, though, is how narrow a range the index has traded in. The chart below compares the frequency of 1% daily moves over a 50-day period (x-axis) to the 50-day high-low range over the corresponding 50-day period (y-axis). With a 50-day range of less than 8%, the last 50 days have been one of the narrowest ranges during a period where the frequency of 1% daily moves has been so high.
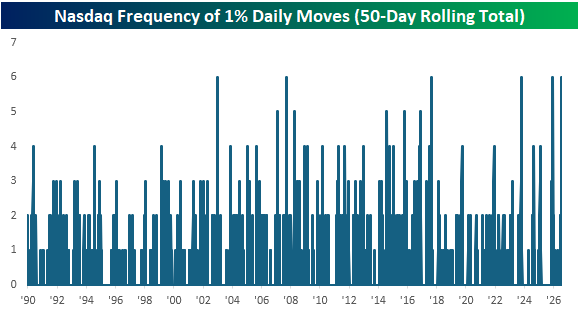
The indecision on where to go for the Nasdaq has really been evident over the last week. Yesterday was the sixth consecutive session that the Nasdaq traded above and below its 50-day moving average on an intraday basis. That’s tied with five other periods for the most consecutive days of straddling the 50-DMA on record. The Nasdaq closed nearly 1% below its 50-DMA yesterday and is on pace to gap down another 1% this morning, so barring a major turnaround intraday (perhaps a Truth Social post), the streak will likely end today. As frustrating as indecision can be, when a direction is finally chosen, it isn’t always the right one.
Start a two-week trial to Bespoke Premium to continue reading today’s full Morning Lineup.
The Closer – Robotics, Housing Dearth, 5 Fed – 7/16/26
Log-in here if you’re a member with access to the Closer.
- Netflix (NFLX) earnings showed record operating incomes despite a dive in free cash flow.
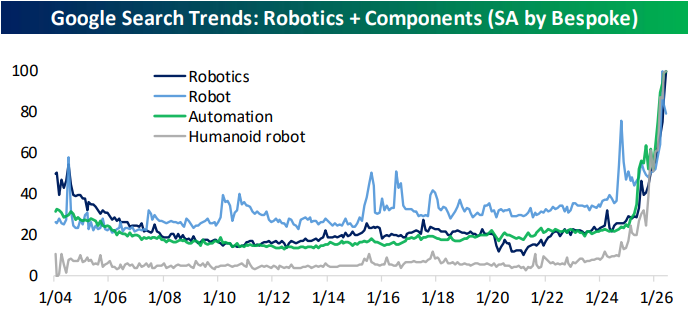
- Robotics appears to be a growing theme with industrial robot orders surging in the past year and Google search interest for related terms rising exponentially.
- Retail sales ex. gasoline has run at a historically strong 10% annualized rate for four of the last five months.
See today’s full post-market Closer and everything else Bespoke publishes by starting a 14-day trial to Bespoke Institutional today!
Q2 2026 Earnings Conference Call Recaps: Wells Fargo (WFC)
Bespoke’s Conference Call Recaps use AI to summarize lengthy earnings calls. The commentary below is AI-generated and then edited by Bespoke for quality control. As always, none of these summaries should be construed as recommendations to buy or sell any securities, and investors should do their own research and/or consult with a financial professional before making any investment decisions.
Our latest recap available to Bespoke subscribers covers Wells Fargo’s (WFC) Q2 2026 earnings call.
![]()
Wells Fargo (WFC) is one of the largest US financial institutions, providing consumer and commercial banking, credit cards, auto and mortgage lending, wealth management, investment banking, trading, payments, and treasury services. WFC’s second-quarter results showed strong growth across the bank after years of being restricted by the Federal Reserve’s asset cap. Earnings per share rose 25% to $2, revenue increased 9%, average loans grew 12%, and deposits rose 10%. Management said the decline in net interest margin is largely intentional. WFC is taking on more lower-margin financing and interest-bearing deposits to win more trading, payments, and investment-banking business from those same clients. Consumer credit remains strong, helped by steady employment and wage growth, while businesses are financially healthy but still cautious about hiring and major spending. Investment banking benefited from active M&A and open debt and equity markets. Management also warned that some banks and non-bank lenders are taking more risk, particularly in wholesale lending and the financing of data centers, power infrastructure, chips, and other parts of the AI buildout. Despite EPS and revenue beats, shares fell 2.6% on 7/14…
Continue reading our Conference Call Recap for WFC by becoming a Bespoke Institutional subscriber. You can sign up for Bespoke Institutional now and receive a 14-day trial to read our newest Conference Call Recap. To sign up, choose either the monthly or annual checkout link below: