One of These Indices Is Not Like the Others
Looking across the major US index ETFs in our Trend Analyzer, one stands out (in a negative way) from all the others. At the moment, the Dow is the only major US index in the red on a year-to-date basis as we close the books on February. Even more notable, is the fact that it’s also the only one below its 50-DMA. Not only is it below its 50-day, but it is trading firmly in oversold territory sitting over 1.5 standard deviations below its 50-day. Today that dynamic of Dow underperformance continues as the index is falling another 0.3% as of this writing while the S&P 500, Nasdaq, and Russell 2,000 are all higher.

In the chart below, we show how far the S&P 500 and Dow are trading (in standard deviations) from their respective 50-DMAs over the past five years. For the most part, the two large-cap indices have tracked one another relatively well in spite of their differences in composition and price calculations. That makes the current situation in which the Dow is oversold without the same applying to the S&P 500 somewhat unusual, albeit not without precedence. While uncommon, there have been periods in which the indices have similarly distanced themselves from one another like most recently in the spring and fall of 2021.
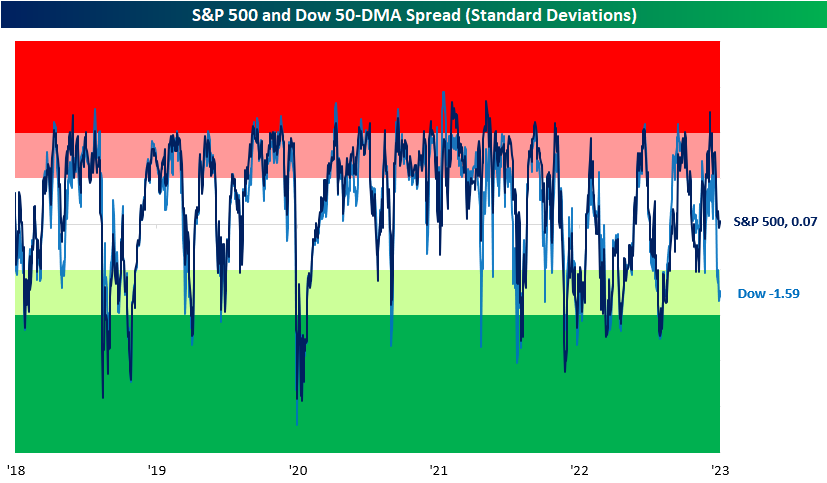
Although there have been other times in which the Dow and S&P’s overbought/oversold readings have deviated from one another, the current example is abnormally large. With a gap of 1.66 standard deviations between the two indices’ overbought/oversold readings versus their 50-DMA spreads, today’s spread ranks in the bottom 1% of all readings since 1952 when the five-day trading week began. Additionally, such low readings have been exceptionally rare in the past 20 years. Outside of June and September of 2021, August 2015 was the last instance of the spread falling this wide with the Dow underperforming. Looking back even further, 2004 was the only other instance of the past 20 years. Click here to learn more about Bespoke’s premium stock market research service.

Tech Relative Strength Still Negative
Each day in our Sector Snapshot, we provide updated charts of the relative strength lines of each sector versus the S&P 500. Outside of a brief period last summer, Technology, the largest sector in terms of market cap, has seen its relative strength line sit in negative territory for nearly the whole of the past year. In other words, the broader market has outperformed the Tech sector almost every day for a year straight. In the chart below, we show the one-year relative strength line of Tech versus the S&P going back to 1991. After some of the most dramatic underperformance of the past couple of decades, Tech rebounded, and the sector has now only underperformed the broader market by a little less than 3% in the past year. While Tech’s relative strength is not as weak as it once was and is closing in on the first positive readings since the mid-summer, today marks the 131st trading day of consecutive negative readings. That is handily the longest streak in nearly a decade and one of only six other times a streak has eclipsed 100 trading days.


The current streak has yet to come to a close, but in the chart below, we show the performance of Tech and the S&P 500 following the conclusion of each of those prior streaks of 100 or more days. Overall, performance does hold a positive bias with positive returns a vast majority of the time. That being said, the average size of those gains is not exactly impressive. In the case of Tech, the average and median gains are smaller than the norm across these time periods. One year out is the starkest difference with an average gain of less than 5% compared to what has typically been a gain that sits in the mid-teens. Likewise, the S&P 500 tends to underperform the norm one year later, but short to medium-term performance is stronger than the norm. Six-month returns, in particular, have been impressive with a move higher every time and an average gain that is more than double that of the typical six-month performance since 1991. Click here to learn more about Bespoke’s premium stock market research service.

Chart of the Day – Consumer Sentiment Towards Stocks Still Sour
Bespoke’s Morning Lineup – 2/28/23 – “What?”
See what’s driving market performance around the world in today’s Morning Lineup. Bespoke’s Morning Lineup is the best way to start your trading day. Read it now by starting a two-week trial to Bespoke Premium. CLICK HERE to learn more and start your trial.
“Life, Liberty, and the Pursuit of Happy Hour.” – Hawkeye Pierce

Below is a snippet of content from today’s Morning Lineup for Bespoke Premium members. Start a two-week trial to Bespoke Premium now to access the full report.
After yesterday’s rally that lost momentum throughout the trading day, futures are looking to start the day higher again today as positive and not as bad as feared earnings have lifted the mood in early trading. Treasury yields are modestly higher but mostly behaving while crude oil is up close to 2%. European stocks are modestly higher and well off their lows of the morning as investors shake off stronger-than-expected inflation data out of France and Spain. On the economic calendar in the US, Wholesale Inventories were just released (weaker than expected; down 0.4% versus +0.1% consensus), and later this morning we’ll get Case Shiller data, Chicago PMI, Consumer Confidence, and Richmond Fed.
40 years ago, tonight, nearly half of all Americans and three-quarters of all TVs in the United States were tuned into the same channel. Never had such a large number of Americans watched the same event at the same time. What were they watching? It wasn’t the Super Bowl. The Redskins had already beaten the Dolphins a month earlier after the strike-shortened season. No, on this Monday night, they were watching Hawkeye Pierce leave the 4077th Mobile Army Surgical Hospital for the last time on the series finale of M.A.S.H. Outside of its first season in 1972, when the show was almost canceled, M.A.S.H. was one of the top-rated shows on TV in every other season of its eleven-year run. M.A.S.H. fans watched the series finale and were sad to see it go, but subconsciously many of them were probably saying good riddance.
M.A.S.H. coincided with a dark period in the American economy, and its end can be looked back on as being symbolic of throwing some of the last vestiges of the 1970s behind us. The fact that the most popular comedy of the 1970s and early 1980s was set on a hospital base in a war zone where the plot of nearly every episode was interrupted by an incoming influx of war casualties says all you need to know about the psyche of Americans in the 1970s.
The chart below shows the performance of the S&P 500 from the first episode of M.A.S.H in September 1972 to the series finale in February 1983. Less than four months after the show first aired, the S&P 500 peaked and went on to lose nearly half of its value over the next 18 months before bottoming out and slowly reclaiming the declines of the bear market over the next several years. In fact, it took three-quarters of a decade before stocks finally made new highs again, and the real breakout of the 1980s bull market wasn’t for another two years after that in August 1982, six months before the show ended.

The performance of the S&P 500 during M.A.S.H. was bad enough in nominal terms, but when you factor in the crushing inflation of that period into the equation, performance was even weaker. After deflating the S&P 500 by headline CPI during the 1970s and early 1980s (gray line), you can see why M.A.S.H was a period of American history many were happy to forget. Is it any surprise that after a decade of high inflation, war, and general economic malaise, that as M.A.S.H. was getting ready to sign off, Americans were now turning the channel to a washed-up baseball player running a bar in Boston? Americans were ready for a drink. Cheers!

Our Morning Lineup keeps readers on top of earnings data, economic news, global headlines, and market internals. We’re biased (of course!), but we think it’s the best and most helpful pre-market report in existence!
Start a two-week trial to Bespoke Premium to read today’s full Morning Lineup.
Daily Sector Snapshot — 2/27/23
Buffett Letters and Berkshire Hathaway (BRK.B) Performance
On Saturday, Warren Buffett’s annual letter to shareholders of Berkshire Hathaway (BRK.B) was posted. Amidst commentary on stock buybacks and a brief discussion of the company’s performance in 2022, the letter did not have any explosive market-moving news or commentary. As a result, price action today has been relatively uneventful. That same sort of sleepy price action also applies to the past few months. Overall, the Oracle of Omaha’s company has been treading water since last fall with a flat 50-DMA and 200-DMA to boot.

Although BRK.B is trending sideways over the past few months, looking back since the start of last year, the stock has performed remarkably well. As shown by the relative strength line below, strong performance in early 2022 (as the equities began to enter a bear market) led BRK.B to massively outperform the S&P 500 (SPY). Although still outperforming, the pattern at the start of this year has been the polar opposite of last year. Given equities have broadly rallied and Berkshire has been rather stagnant, the stock’s relative strength has taken a sharp turn lower headed into this weekend’s letter and the annual conference coming up in a few months.

In the table below, we break down the performance of the company’s b-shares after the release of Buffett’s annual letters. Again, the stock’s reaction today has been a bit muted, with the flat move lower than the historical average of a 0.54% gain. Going forward, performance has been mixed. While one week and one month out from the letter have averaged gains and positive moves more than half the time, three months later has seen BRK.B fall more than half the time. From there, consistent with what has tended to be Mr. Buffett’s optimistic long-term view, performance has tended to be more consistently positive with a move higher nearly two-thirds of the time one year later for an average gain of 13.7%. Click here to learn more about Bespoke’s premium stock market research service.

Chart of the Day – March Seasonality
Bespoke’s Matrix of Economic Indicators – 2/27/23
Our Matrix of Economic Indicators provides a concise summary analysis of the US economy’s momentum. We combine trends across the dozens and dozens of economic indicators in various categories like manufacturing, employment, housing, the consumer, and inflation to provide a directional overview of the economy.
To access our newest Matrix of Economic Indicators, start a two-week free trial to either Bespoke Premium or Bespoke Institutional now!

Bespoke’s Morning Lineup – 2/27/23 – Regrouping
See what’s driving market performance around the world in today’s Morning Lineup. Bespoke’s Morning Lineup is the best way to start your trading day. Read it now by starting a two-week trial to Bespoke Premium. CLICK HERE to learn more and start your trial.
“Money cannot consistently be made trading every day or every week during the year.” – Jesse Livermore
Below is a snippet of content from today’s Morning Lineup for Bespoke Premium members. Start a two-week trial to Bespoke Premium now to access the full report.
It may have only been four trading days, but last week was a tough one for the bulls. When the dust finally settled, the S&P 500 closed modestly back below its 50-day moving average as well as its uptrend from the October lows. If the market can recover quickly from here, technicians will look past Friday’s breakdown as it wasn’t entirely convincing, but for now, the burden of proof has shifted to the bulls. One thing we can be pretty confident of is that with less than 1% separating them, by the end of the week, the S&P 500 will probably either be above both its 50 and 200-day moving averages or below them.

Our Morning Lineup keeps readers on top of earnings data, economic news, global headlines, and market internals. We’re biased (of course!), but we think it’s the best and most helpful pre-market report in existence!
Start a two-week trial to Bespoke Premium to read today’s full Morning Lineup.
Bespoke Brunch Reads: 2/26/23
Welcome to Bespoke Brunch Reads — a linkfest of the favorite things we read over the past week. The links are mostly market related, but there are some other interesting subjects covered as well. We hope you enjoy the food for thought as a supplement to the research we provide you during the week.
While you’re here, join Bespoke Premium with a 30-day trial!
Warfare
How Putin blundered into Ukraine — then doubled down by Max Seddon, Christopher Miller, and Felicia Schwartz (FT)
A detailed look at the psychology, advisors, and historical misconceptions that led Russia to its disastrous invasion of Ukraine, a war that has now claimed over 200,000 casualties within Russia’s military alone. [Link; paywall]
Sensitive US military emails spill online by Zack Whittaker (Tech Crunch)
A Microsoft Azure cloud server hosting Department of Defense emails was open to the public internet for two weeks, spilling years of emails and personal information, though none of the exposed emails appear to be classified. [Link]
State Policy
Frontier Institute Statement In Support of SB 323 (Frontier Institute)
A libertarian think tank in Montana has penned this endorsement of SB 323, a bill reforming zoning regulations and allowing higher density home construction. In what can only be described as trolling, the institute argues “we don’t want Montana to become like California” by preventing cities from building housing up instead of sprawling out. [Link]
Kids Buying Weed From Bodegas Wasn’t in the ‘Legal Weed’ Plan by Ginia Bellafante (NYT)
Legalization of marijuana in New York City is proceeding about how one would expect: messy, entrepreneurial, controversial, and confusing. The result is widespread underground marijuana sales at bodegas as legal dispensaries struggle to navigate state licensure. [Link; soft paywall]
Energy Markets
Global distillate fuel oil inventories by John Kemp (Reuters)
A helpful rundown on extremely tight global inventories of distillate (diesel) fuels which are extremely low thanks to the disruptions of the war in Ukraine. [Link; 15 page PDF]
Big Tech
Google asks some employees to share desks amid office downsizing by Jennifer Elias (CNBC)
Looking to save money on real estate amidst a boom in work from home, Google is asking employees at its cloud unit to share desk space at its 5 largest locations. [Link]
China tells big tech companies not to offer ChatGPT services by Cissy Zhou (Nikkei Asia)
OpenAI’s chatbot is not finding fans at the Chinse Communist Party, as regulators have instructed companies like Tencent and Ant Group to avoid offering access on their platforms. [Link; soft paywall]
The quietest place on earth will drive you insane (The Jerusalem Post/Walla! Health)
In a quiet enough room, you can hear your heart beat, the flow of blood through your body, and the creak of your bones. Why Microsoft would want to build a torture chamber like this is a bit beyond us but they did it. [Link]
Industrial Policy
Tesla Makes US the Focus of Battery-Making Efforts in Blow to Germany by Wilfried Eckl-Dorna (Bloomberg)
Tesla has decided to manufacture battery cells in the US instead of Germany thanks to the incentives in the Inflation Reduction Act passed last year. Tax credits in the act cover as much as 30% of the operating costs for cell manufacturers. [Link; soft paywall]
Business Models
Pay-Per-Chew: More restaurants trying subscription programs (Fox 5 NY)
In an effort to generate more predictable revenue streams and draw repeat customers, mom and pop shops are following the lead of Silicon Valley and offering subscriptions for loyal customers. [Link]
Odd News
The FBI searched the Pennsylvania wilderness for a cache of gold. A treasure hunter wants to know what it found. (CBS)
While the FBI claims there was nothing found when it searched for a Civil War-era gold cache, but competing treasure hunters think they might be hiding something. [Link]
Read Bespoke’s most actionable market research by joining Bespoke Premium today! Get started here.
Have a great weekend!