The Bespoke 50 Growth Stocks — 3/30/23
The “Bespoke 50” is a basket of noteworthy growth stocks in the Russell 3,000. To make the list, a stock must have strong earnings growth prospects along with an attractive price chart based on Bespoke’s analysis. The Bespoke 50 is updated weekly on Thursday unless otherwise noted. There were no changes to the list this week.
The Bespoke 50 is available with a Bespoke Premium subscription or a Bespoke Institutional subscription. You can learn more about our subscription offerings at our Membership Options page, or simply start a two-week trial at our sign-up page.

The Bespoke 50 performance chart shown does not represent actual investment results. The Bespoke 50 is updated weekly on Thursday. Performance is based on equally weighting each of the 50 stocks (2% each) and is calculated using each stock’s opening price as of Friday morning each week. Entry prices and exit prices used for stocks that are added or removed from the Bespoke 50 are based on Friday’s opening price. Any potential commissions, brokerage fees, or dividends are not included in the Bespoke 50 performance calculation, but the performance shown is net of a hypothetical annual advisory fee of 0.85%. Performance tracking for the Bespoke 50 and the Russell 3,000 total return index begins on March 5th, 2012 when the Bespoke 50 was first published. Past performance is not a guarantee of future results. The Bespoke 50 is meant to be an idea generator for investors and not a recommendation to buy or sell any specific securities. It is not personalized advice because it in no way takes into account an investor’s individual needs. As always, investors should conduct their own research when buying or selling individual securities. Click here to read our full disclosure on hypothetical performance tracking. Bespoke representatives or wealth management clients may have positions in securities discussed or mentioned in its published content.
Sentiment Still Bearish…Or Is It?
The S&P 500 has made a press back up towards the high end of the past month’s range this week, but sentiment has yet to reflect the moves higher in price. The past several weeks have seen the AAII sentiment survey come in a relatively tight range between the high of 24.8% on March 9th and a low of 19.2% the following week. That is in spite of the recent updates to monetary policy and turbulence in the banking industry. Today’s reading was smack dab in the middle of that recent range at 22.5%.
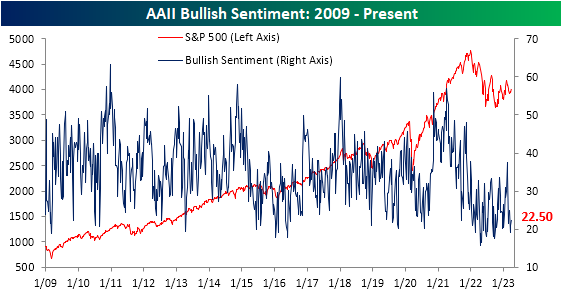
Given there have not been any major developments with regard to sentiment, the record streak of below-average (37.55%) bullish sentiment readings has grown to 71 weeks.

While bullish sentiment was modestly higher this week rising 1.6 percentage points, bearish sentiment shed 3.3 percentage points to fall to 45.6%. That is only the lowest reading in three weeks as bearish sentiment has sat above 40% for all of March.
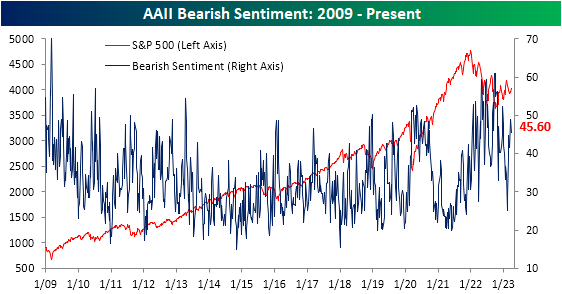
The predominant sentiment reading continues to be bearish. The bull-bear spread has been negative for six weeks in a row following the end of the record streak of negative readings in the bull-bear spread in February.

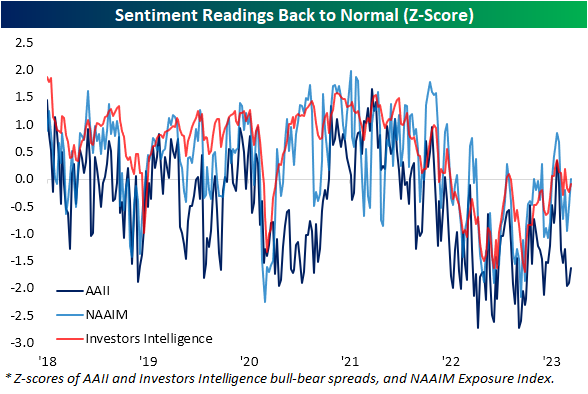
Taking into account other sentiment surveys, the AAII reading stands out as far more pessimistic at the moment. In the chart below, we show the readings of the AAII bull-bear spread paired with the same spread in the Investors Intelligence survey and the NAAIM Exposure index. Whereas the latter two surveys have basically seen readings return back to their historical averages, the AAII survey sits 1.6 standard deviations below its historical average. In other words, overall sentiment might not be as pessimistic as the AAII survey would imply.
Have you tried Bespoke All Access yet?
Bespoke’s All Access research package is quick-hitting, actionable, and easily digestible. Bespoke’s unique data points and analysis help investors better visualize underlying market trends to ultimately make more informed investment decisions.
Our daily research consists of a pre-market note, a post-market note, and our Chart of the Day. These three daily reports are supplemented with additional research pieces covering ETFs and asset allocation trends, global macro analysis, earnings and conference call analysis, market breadth and internals, economic indicator databases, growth and dividend income stock baskets, and unique interactive trading tools.
Click here to sign up for a one-month trial to Bespoke All Access, or you can read even more about Bespoke All Access here.

Claims Spend Another Week Below 200K
Initial jobless claims took a step higher this week rising by 7K to 198K. With last week’s number also going unrevised, claims have now been below 200K for 10 of the last 11 weeks. That being said, this week’s reading was the highest since the 212K print in the first week of March.

Before seasonal adjustment, claims were once again higher rising by over 10K week over week to 223K. Although that is not a concerningly high reading nor is it a large jump, the increase was peculiar in that it went against expected seasonal patterns. Prior to this year, jobless claims have only risen week over week in the current week of the year 16% of the time; the most recent instance prior to 2020 (right as claims surged at the onset of the pandemic) was in 2017.

Although initial jobless claims modestly deteriorated, it has not exactly been a worrying increase as claims remain at historically healthy levels. The same goes for continuing claims. This week saw continuing claims rise by a modest 4K to 1.689 million. That is only the highest level since the end of February when claims totaled over 1.7 million.

Have you tried Bespoke All Access yet?
Bespoke’s All Access research package is quick-hitting, actionable, and easily digestible. Bespoke’s unique data points and analysis help investors better visualize underlying market trends to ultimately make more informed investment decisions.
Our daily research consists of a pre-market note, a post-market note, and our Chart of the Day. These three daily reports are supplemented with additional research pieces covering ETFs and asset allocation trends, global macro analysis, earnings and conference call analysis, market breadth and internals, economic indicator databases, growth and dividend income stock baskets, and unique interactive trading tools.
Click here to sign up for a one-month trial to Bespoke All Access, or you can read even more about Bespoke All Access here.
Chart of the Day: 60-40 In Comeback Mode
Bespoke’s Morning Lineup – 3/30/23 – Play Ball
See what’s driving market performance around the world in today’s Morning Lineup. Bespoke’s Morning Lineup is the best way to start your trading day. Read it now by starting a two-week trial to Bespoke Premium. CLICK HERE to learn more and start your trial.
“Russia has sold us a sucked orange… has therefore done wisely in selling the territory and islands which to her had become useless.” – New York World, 4/1/1867

Below is a snippet of content from today’s Morning Lineup for Bespoke Premium members. Start a two-week trial to Bespoke Premium now to access the full report.
After the Nasdaq 100 closed at the highest levels since Powell’s Jackson Hole speech last August, investors are looking to close out the quarter on a positive note. A bunch of economic data just hit the tape, and there weren’t a lot of big surprises. Initial Jobless Claims came in slightly higher than expected (198K vs 196K) while Continuing Claims came in modestly below forecasts. The final read of Q4 GDP was revised lower by a tenth of a percent to 2.6% from 2.7%. One piece of bad news was Core PCE which was revised up to 4.4% versus forecasts for a reading of 4.3%. The market reaction to the news has been muted with only a slight ding to the positive tone in futures and a slight upward move in interest rates.
When news surfaced that Secretary of State William Seward had negotiated to purchase Alaska from Russia on this day in 1867, “Seward’s Folly” was widely ridiculed in the press and the public as a waste of money for land that was nothing but ice and frozen dirt. By the late 1800s, Alaska’s main trade of fur had been largely depleted due to overhunting that resulted in the near extinction of sea otters. Also, other minerals couldn’t be mined because of the climate conditions in the area.
Little did anyone know at the time how rich the Alaskan territory was in terms of oil and gold and that advances in mining would make these resources more accessible. In terms of oil alone, according to the Department of Energy, Alaska produced an average of 437K barrels of oil per day last year which works out to roughly $35 million! Seward’s $7.2 million purchase of Alaska translates to $146 million in today’s dollars, so even after adjusting for inflation, the amount of oil that comes out of the ground in Alaska every five days is more than enough to cover what the US paid for the entire state!
There are two important investment lessons that investors can take from “Seward’s Treasure”. First, the largest returns don’t usually come when you’re following the crowd (think tech’s performance so far this year and sentiment towards the sector heading into 2023). Second, no matter how bad an investment may look in the short term, the more time you are willing to give it, the better it will likely look down the road.

Our Morning Lineup keeps readers on top of earnings data, economic news, global headlines, and market internals. We’re biased (of course!), but we think it’s the best and most helpful pre-market report in existence!
Start a two-week trial to Bespoke Premium to read today’s full Morning Lineup.
Daily Sector Snapshot — 3/29/23
Chart of the Day: April Seasonality
Pending Home Sales Better But Still Weak
As we noted on Twitter earlier, Pending Home Sales for the month of February came in better than expected, rising by 0.8% compared to forecasts for a 3.0% decline. Wednesday’s report also marked the first string of back to back to back positive and better-than-expected readings since the second half of 2020. While the increases are welcomed, we would note that on a y/y basis, Pending Home Sales remain depressed. Relative to a year ago, February Pending Home sales declined 21.1% which is actually an improvement from late last year when they were down over 30% for three straight months.
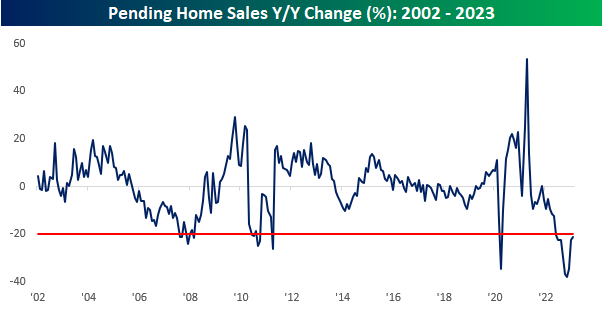
A 20%+ y/y decline in Pending Home Sales is not unprecedented, but it isn’t common either. Prior to the current period, the only other times they were down over 20% were in the early months of COVID and in a handful of other months during and immediately after the financial crisis. What has been unprecedented about the current period is the fact that Pending Home Sales has been down 20%+ for nine straight months! Going back to 2002, there was never another period where Pending Home Sales were down 20%+ or more for even three months let alone nine!

Have you tried Bespoke All Access yet?
Bespoke’s All Access research package is quick-hitting, actionable, and easily digestible. Bespoke’s unique data points and analysis help investors better visualize underlying market trends to ultimately make more informed investment decisions.
Our daily research consists of a pre-market note, a post-market note, and our Chart of the Day. These three daily reports are supplemented with additional research pieces covering ETFs and asset allocation trends, global macro analysis, earnings and conference call analysis, market breadth and internals, economic indicator databases, growth and dividend income stock baskets, and unique interactive trading tools.
Click here to sign up for a one-month trial to Bespoke All Access, or you can read even more about Bespoke All Access here.
Bespoke’s Morning Lineup – 3/29/23 – Global Optimism
See what’s driving market performance around the world in today’s Morning Lineup. Bespoke’s Morning Lineup is the best way to start your trading day. Read it now by starting a two-week trial to Bespoke Premium. CLICK HERE to learn more and start your trial.
“Anyone who isn’t confused really doesn’t understand the situation.” – Edward R Murrow
Below is a snippet of content from today’s Morning Lineup for Bespoke Premium members. Start a two-week trial to Bespoke Premium now to access the full report.
50 years ago today, the United States officially withdrew from Vietnam ending what was at the time the longest war in US history and easily the least popular. Five decades is a long time, but it’s also hard to imagine how quickly things can change in that time or even shorter.
You don’t need to look at the back of an electronic device or a tag of clothing to realize that China has long been considered the factory to the world. However, beginning under the Trump Administration, China has, for numerous reasons, been losing its allure as a place for companies to source production and manufacturing. That trend was only exacerbated by COVID as shattered supply chains, strict COVID-zero policies, and the desire of companies not to have all their production eggs in one basket all resulted in what has become a wave of diversification. China still remains the dominant global manufacturing source for cheap production, but other countries in the region have picked up share.
Enter Vietnam. The chart below shows the relative strength of the MSCI China ETF (MCHI) versus the VanEck Vietnam ETF (VNM). From 2013 right up through the end of Q1 2020, Chinese stocks handily outperformed China, but right when COVID hit, that outperformance came to a screeching halt. Within a year after the onset of COVID, it became clear that China would maintain its strict COVID policies, investors and manufacturers looked elsewhere. For the next year, Vietnamese stocks crushed Chinese stocks on a relative basis. Over the last several months as China has reopened, some of the outperformance by Vietnam has reversed, but the momentum of Chinese stocks in the years from 2013 through 2020 is a broken trend.

Closer to home, Mexico has also been a winner in the wave of global manufacturing diversification. While it doesn’t have the manufacturing infrastructure of China, for certain applications or sectors, Mexico has been able to pick up share as companies save on the costs and time of shipping and can more easily oversee operations. Given that Mexico’s economy is also one-fifth the size of China, a ‘little’ loss of share in China goes a much longer way in Mexico.
The shift in Mexico’s fortunes has clearly been reflected in the performance of Mexican stocks, especially relative to China. Like the chart above, the one below compares the relative strength of the MSCI China ETF (MCHI) to the MSCI Mexico (EWW) over the last ten years. Again, right up to and in the very early days of COVID, China handily outperformed Mexico, but early in the pandemic, the attractiveness of Mexico started to improve, and in the span of just over two years, Mexico has erased pretty much all of China’s outperformance from the prior eight years. Looking at charts like these is it any wonder that China was quick to pretty much drop all of its COVID restrictions in the last few months?

Our Morning Lineup keeps readers on top of earnings data, economic news, global headlines, and market internals. We’re biased (of course!), but we think it’s the best and most helpful pre-market report in existence!
Start a two-week trial to Bespoke Premium to read today’s full Morning Lineup.