Bespoke Stock Scores — 4/18/23
Sector Breadth All Over the Place
In terms of price, the Industrials sector remains 5.75% below its high from January of last year and has yet to even take out the highs from earlier this year, but breadth has been more constructive recently. Just yesterday, the sector’s cumulative advance/decline line—the cumulative sum of the sector’s daily difference in the number of advancing and declining stocks—hit a new all time high.
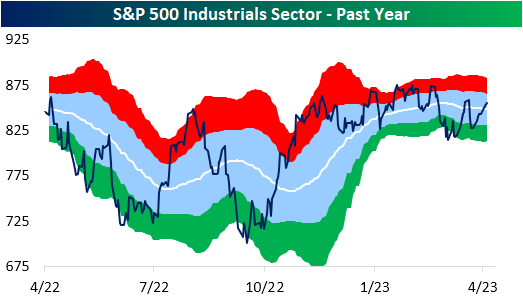

Although that measure of breadth is making promising moves, other breadth measures have not exactly echoed that strength. In spite of the record high in the cumulative A/D line Monday, only 37% of the sector’s stocks finished above their 50-DMAs. As shown below, of all other instances of a record high in the cumulative AD line, there has never been such a low reading in the percentage of stocks above their 50-DMAs. In fact, no other readings have even crossed into the 30% range! For the vast majority of previous highs, the percentage of stocks above their 50-DMAs has sat at 70% or more.

All that is to say that most Industrials sector stocks are moving higher, but have not yet moved above potential resistance at their 50-DMAs. And even though the reading on the percentage of stocks above their 50-DMAs is low at the moment, that is not to say it is not improving rapidly. As shown below, it has risen sharply from the low of 19.18% on April 6th. Furthermore, whereas Monday’s close only saw 37% of the sector finish above their 50-DMAs, as of mid-morning Tuesday, the reading is already up another 8.2 percentage points to 45.2% as the average stock in the sector trades just 7 bps below its 50-DMA.

Have you tried Bespoke All Access yet?
Bespoke’s All Access research package is quick-hitting, actionable, and easily digestible. Bespoke’s unique data points and analysis help investors better visualize underlying market trends to ultimately make more informed investment decisions.
Our daily research consists of a pre-market note, a post-market note, and our Chart of the Day. These three daily reports are supplemented with additional research pieces covering ETFs and asset allocation trends, global macro analysis, earnings and conference call analysis, market breadth and internals, economic indicator databases, growth and dividend income stock baskets, and unique interactive trading tools.
Click here to sign up for a one-month trial to Bespoke All Access, or you can read even more about Bespoke All Access here.

Historic Divergence in Tech Price and Breadth
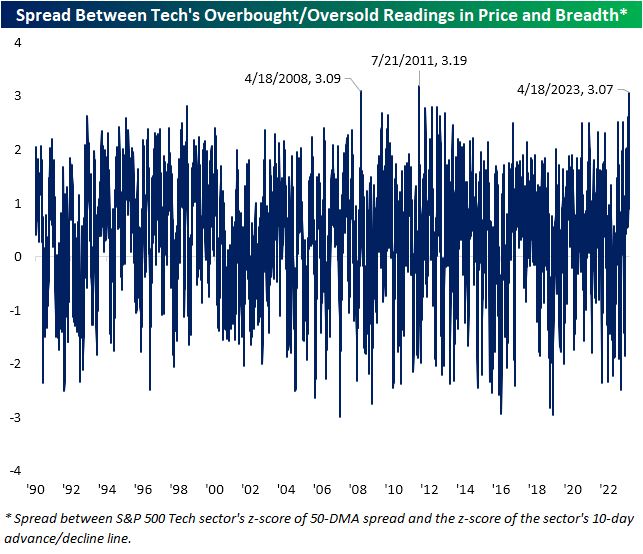
Each day in our Sector Snapshot, we highlight the overbought and oversold readings of each S&P 500 sector based on price and breadth. For price, we consider a sector to be overbought when it trades at least one standard deviation above its 50-DMA and oversold when it is one standard deviation below its 50-DMA. For breadth, we look at the 10-day advance-decline line. Again, when the 10-day A/D line rises at least one standard deviation above its historical average, it can be considered overbought and vice versa.
The Tech sector is in an unusual place in which price has been overbought for the entirety of the past month while short-term breadth has dropped into oversold territory in the past two sessions.

Taking a spread of the two measures, that is nearly a record divergence. As shown below, there have only been two other times in which there has been a three-standard deviation difference between the overbought/oversold levels of price and breadth. The most recent of these was in July 2011 when similar to now, the sector traded over 1.4 standard deviations above its 50-DMA while the 10-day A/D line was over a standard deviation below its historical average. The other instance was exactly 15 years ago in April 2008. That time was slightly different in that price was extremely overbought trading 3 standard deviations above its 50-DMA while breath was neutral and only slightly negative.
Given the Tech sector has managed to perform well on unimpressive breadth, it would imply mega caps are buoying the market cap-weighted index.
Have you tried Bespoke All Access yet?
Bespoke’s All Access research package is quick-hitting, actionable, and easily digestible. Bespoke’s unique data points and analysis help investors better visualize underlying market trends to ultimately make more informed investment decisions.
Our daily research consists of a pre-market note, a post-market note, and our Chart of the Day. These three daily reports are supplemented with additional research pieces covering ETFs and asset allocation trends, global macro analysis, earnings and conference call analysis, market breadth and internals, economic indicator databases, growth and dividend income stock baskets, and unique interactive trading tools.
Click here to sign up for a one-month trial to Bespoke All Access, or you can read even more about Bespoke All Access here.
Chart of the Day: Starts and Stocks Give Conflicting Signals
Bespoke’s Morning Lineup – 4/18/23 – Here Comes the Tax Man
See what’s driving market performance around the world in today’s Morning Lineup. Bespoke’s Morning Lineup is the best way to start your trading day. Read it now by starting a two-week trial to Bespoke Premium. CLICK HERE to learn more and start your trial.
“The income tax created more criminals than any other single act of government.” – Barry Goldwater

Below is a snippet of content from today’s Morning Lineup for Bespoke Premium members. Start a two-week trial to Bespoke Premium now to access the full report.
It’s a positive tone in the futures market this morning as the market builds on yesterday’s gains with some strong earnings reports from Bank of America (BAC), J&J (JNJ), and Lockheed Martin (LMT). It hasn’t all been sunshine and lollipops, though, as both Goldman Sachs (GS) and JB Hunt (JBHT) are down close to 4%. Coming up as we send this, we’ll get updates on Building Permits and Housing Starts at 8:30 Eastern.
Accountants across the country are breathing a sigh of relief this morning as they close the books on another tax season, although their relief is probably being drowned out by the collective swearing on the part of Americans who have taxes due. While today may be the worst day of the year for Americans who owe any taxes, it could get even worse for a lot of Americans this year as IRS plans to hire 87,000 new agents will inevitably lead to a lot more Americans being audited as well!
As bad as Tax Day may be for many Americans, seasonally it isn’t the worst time of year. In fact, over the last 25 years, the S&P 500 has been up in the week after the Federal Tax deadline 19 times for a median gain of 0.83%. That compares to a median gain of 0.31% with positive returns 57% of the time for all one-week periods over the last 25 years.

Our Morning Lineup keeps readers on top of earnings data, economic news, global headlines, and market internals. We’re biased (of course!), but we think it’s the best and most helpful pre-market report in existence!
Start a two-week trial to Bespoke Premium to read today’s full Morning Lineup.
Chart of the Day: Six Months Without a New Low
Daily Sector Snapshot — 4/17/23
Homebuilder Sentiment and Stocks Trend in Opposite Directions
Homebuilder sentiment from the National Association of Home Builders (NAHB) was updated this morning. As expected, the headline index rose from 44 in March to 45. Of the sub-indices, increases in both present and future sales drove the headline reading higher. While those readings remain relatively muted versus most of the past decade, it reiterates the modest improvement in sentiment we have seen this year. In fact, and as shown in the second chart below, homebuilder sentiment’s improvement over the past four months marks the longest streak of monthly increases since another streak lasting for four months that ended in December 2021.


As for the regional breakdown, sentiment in the Northeast and South was unchanged versus last month which leaves the indices in the middle of their historical ranges. The Midwest saw more substantial improvement rising by 3 points to the highest level since September. The West experienced an even more substantial increase of five points. That month-over-month increase ranks in the 85th percentile of all moves on record for that sub-index.

Although the NAHB’s reading on homebuilders has improved over the past few months, homebuilder stocks as proxied by the SPDR S&P Homebuilder ETF (XHB) have been trending lower since February. Recently, XHB has run up to its 50-DMA (which has begun to roll over) and the downtrend line off the aforementioned early February high. So far, XHB has failed to break out.

Have you tried Bespoke All Access yet?
Bespoke’s All Access research package is quick-hitting, actionable, and easily digestible. Bespoke’s unique data points and analysis help investors better visualize underlying market trends to ultimately make more informed investment decisions.
Our daily research consists of a pre-market note, a post-market note, and our Chart of the Day. These three daily reports are supplemented with additional research pieces covering ETFs and asset allocation trends, global macro analysis, earnings and conference call analysis, market breadth and internals, economic indicator databases, growth and dividend income stock baskets, and unique interactive trading tools.
Click here to sign up for a one-month trial to Bespoke All Access, or you can read even more about Bespoke All Access here.
Europe Treasure
For an area of the world that couldn’t have been considered less attractive last summer, European equities have been on a tear since the October lows. The Euro Stoxx 50 Europe ETF has now rallied more than 50% off its October lows and broke out to 52-week highs last week.

The S&P 500, meanwhile, hasn’t fared nearly as well. While it has formed a gradual uptrend from its October lows, SPY currently has three prior highs (February 2023, August 2022, and April 2022) standing between it and 52-week highs.

Other parts of the global equity market spectrum haven’t been able to keep up with Europe either. Emerging markets, as tracked by the iShares MSCI Emerging Markets ETF (EEM), rallied sharply off its lows in October, but that rally ran out of gas in early February and hasn’t been able to recover. Like the S&P 500, EEM remains well below 52-week highs from last April.

Since Europe accounts for a major share of international equity market cap, the MSCI All Country World Ex US ETF (CWI) is much closer to 52-week highs than EEM, but it still has a number of resistance points to clear.
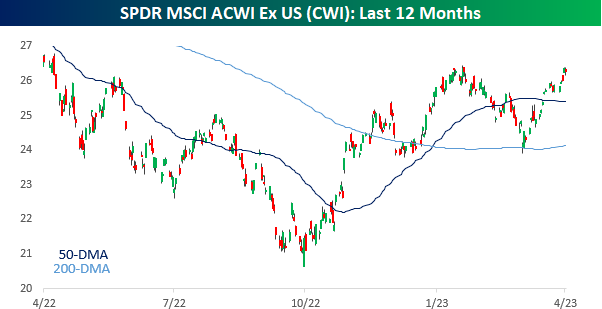
The chart below compares the relative strength of all three ETFs (FEZ, EEM, CWI) to the S&P 500 (SPY) over the last three years and provides a clear look at how Europe has led the global rally. From April 2020 through April 2021, all three ETFs outperformed the S&P 500, but then they really started to underperform as the US economy reopened and the FOMC later started to hike rates. Last October was the major turning point for global stocks, though, as the relative strength for all three ETFs made multi-year lows. While they’ve all started to reverse, only Europe has managed to erase all of its underperformance from the post-COVID period and move into the black versus the S&P.

Have you tried Bespoke All Access yet?
Bespoke’s All Access research package is quick-hitting, actionable, and easily digestible. Bespoke’s unique data points and analysis help investors better visualize underlying market trends to ultimately make more informed investment decisions.
Our daily research consists of a pre-market note, a post-market note, and our Chart of the Day. These three daily reports are supplemented with additional research pieces covering ETFs and asset allocation trends, global macro analysis, earnings and conference call analysis, market breadth and internals, economic indicator databases, growth and dividend income stock baskets, and unique interactive trading tools.
Click here to sign up for a one-month trial to Bespoke All Access, or you can read even more about Bespoke All Access here.