Chart of the Day: May Deciles
Bespoke’s Weekly Sector Snapshot — 6/1/23
Target’s (TGT) Troubles
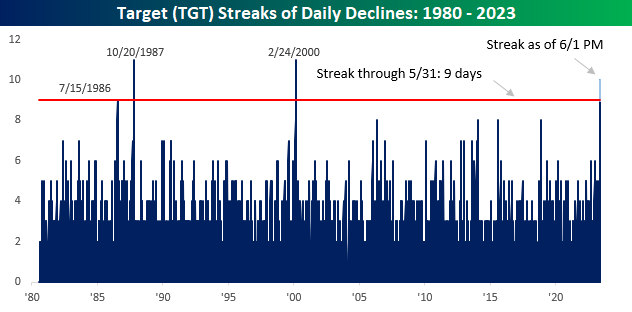
It’s been a miserable couple of weeks for shares of Target (TGT) as the stock is on pace for its tenth straight day of losses today. Whether or not the stock closes up or down today, the nine-day losing streak heading into Thursday was the longest in more than 23 years, and there have only been three other streaks that were as long or longer than the current one.
While shares of Target (TGT) have been down sharply over the last two weeks (-20.2%), its main competitor Walmart (WMT) hasn’t had nearly as rough of a time as its shares are down just 1.5%. At the current level of -18.7 percentage points, the two-week performance spread between TGT and WMT is at an extreme, and there are only a handful of other periods since 1980 where the spread was wider in WMT’s favor. What’s ironic, however, is that exactly a year ago today, TGT’s two-week underperformance versus WMT was even wider at -22.8 percentage points. Back then it was a disastrous earnings report that caused the stock to crater.

The recent weakness in TGT has been mostly attributed to a negative backlash from the merchandise associated with the company’s Pride campaign, and while that may have accelerated the decline, it’s important to note that the stock has been steadily underperforming WMT for well over a year now. The chart below shows the relative strength of TGT versus WMT over the last five years. While TGT was a big beneficiary relative to WMT during the year after COVID when consumers were flush with cash, once the checks stopped, so too did the outperformance. As of today, the stock’s relative strength versus WMT is at the lowest level since the first half of 2020.

Have you tried Bespoke All Access yet?
Bespoke’s All Access research package is quick-hitting, actionable, and easily digestible. Bespoke’s unique data points and analysis help investors better visualize underlying market trends to ultimately make more informed investment decisions.
Our daily research consists of a pre-market note, a post-market note, and our Chart of the Day. These three daily reports are supplemented with additional research pieces covering ETFs and asset allocation trends, global macro analysis, earnings and conference call analysis, market breadth and internals, economic indicator databases, growth and dividend income stock baskets, and unique interactive trading tools.
Click here to sign up for a one-month trial to Bespoke All Access, or you can read even more about Bespoke All Access here.

The Bespoke 50 Growth Stocks — 6/1/23
The “Bespoke 50” is a basket of noteworthy growth stocks in the Russell 3,000. To make the list, a stock must have strong earnings growth prospects along with an attractive price chart based on Bespoke’s analysis. The Bespoke 50 is updated weekly on Thursday unless otherwise noted. There were seven changes to the list this week.
The Bespoke 50 is available with a Bespoke Premium subscription or a Bespoke Institutional subscription. You can learn more about our subscription offerings at our Membership Options page, or simply start a two-week trial at our sign-up page.
To see all 50 stocks that currently make up the Bespoke 50, simply start a two-week trial to Bespoke Premium or Bespoke Institutional.
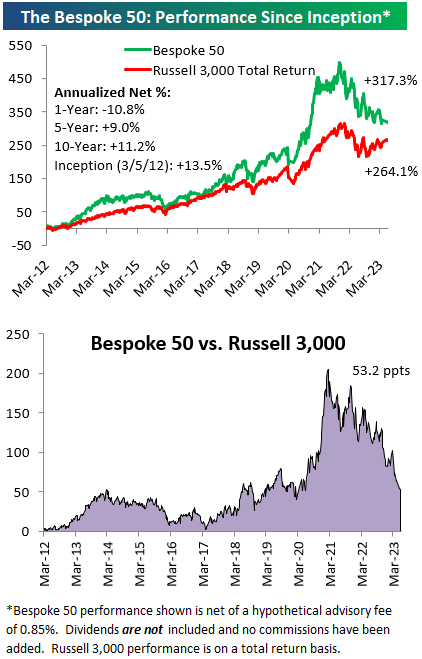
The Bespoke 50 performance chart shown does not represent actual investment results. The Bespoke 50 is updated weekly on Thursday. Performance is based on equally weighting each of the 50 stocks (2% each) and is calculated using each stock’s opening price as of Friday morning each week. Entry prices and exit prices used for stocks that are added or removed from the Bespoke 50 are based on Friday’s opening price. Any potential commissions, brokerage fees, or dividends are not included in the Bespoke 50 performance calculation, but the performance shown is net of a hypothetical annual advisory fee of 0.85%. Performance tracking for the Bespoke 50 and the Russell 3,000 total return index begins on March 5th, 2012 when the Bespoke 50 was first published. Past performance is not a guarantee of future results. The Bespoke 50 is meant to be an idea generator for investors and not a recommendation to buy or sell any specific securities. It is not personalized advice because it in no way takes into account an investor’s individual needs. As always, investors should conduct their own research when buying or selling individual securities. Click here to read our full disclosure on hypothetical performance tracking. Bespoke representatives or wealth management clients may have positions in securities discussed or mentioned in its published content.
Bespoke Market Calendar — June 2023
Please click the image below to view our June 2023 market calendar. This calendar includes the S&P 500’s historical average percentage change and average intraday chart pattern for each trading day during the upcoming month. It also includes market holidays and options expiration dates plus the dates of key economic indicator releases. Click here to view Bespoke’s premium membership options.

May and YTD 2023 Asset Class Performance
May 2023 is now behind us, and below is a look at how various asset classes performed during the month using US-listed exchange-traded products as proxies. We also include YTD and YoY total returns.
May was a month of divergence where Tech/AI soared, and the rest of the market fell. Notably, the Nasdaq 100 ETF (QQQ) gained 7.88% in May while the Dow Jones Dividend ETF (DVY) fell 7.7%. That’s a 15 percentage-point spread!
At the sector level, it was a similar story. While the Tech sector (XLK) rose 8.9%, sectors like Energy (XLE), Consumer Staples (XLP), Materials (XLB), and Utilities (XLU) fell more than 5%. In total, 8 of 11 sectors were in the red for the month.
Outside the US, we saw pullbacks in most areas of the world other than Brazil, India, and Japan. China, Hong Kong, France, Canada, Italy, Spain, and the UK all fell more than 5%.
All of the commodity-related ETFs/ETNs were in the red for May, with oil (USO) and natural gas (UNG) falling the most at more than 10% each.
Finally, fixed-income ETFs also fell in May as interest rates bounced back. The aggregate bond market ETF (AGG) was down 1.14% in May, leaving it up just 2.6% YTD and down 2.2% year-over-year.

Have you tried Bespoke All Access yet?
Bespoke’s All Access research package is quick-hitting, actionable, and easily digestible. Bespoke’s unique data points and analysis help investors better visualize underlying market trends to ultimately make more informed investment decisions.
Our daily research consists of a pre-market note, a post-market note, and our Chart of the Day. These three daily reports are supplemented with additional research pieces covering ETFs and asset allocation trends, global macro analysis, earnings and conference call analysis, market breadth and internals, economic indicator databases, growth and dividend income stock baskets, and unique interactive trading tools.
Click here to sign up for a one-month trial to Bespoke All Access, or you can read even more about Bespoke All Access here.
Bespoke’s Morning Lineup – 6/1/23 – Like Oil and Water
See what’s driving market performance around the world in today’s Morning Lineup. Bespoke’s Morning Lineup is the best way to start your trading day. Read it now by starting a two-week trial to Bespoke Premium. CLICK HERE to learn more and start your trial.
“When people see some things as beautiful, other things become ugly. When people see some things as good, other things become bad.” – Lao Tzu

Below is a snippet of content from today’s Morning Lineup for Bespoke Premium members. Start a two-week trial to Bespoke Premium now to access the full report.
Flat on either side of unchanged. That’s where futures stand this morning heading into what is going to be a very busy day for economic data. Things started off with ADP Private Payrolls at 8:15 which came in much stronger than expected at a level of 278K versus forecasts for an increase of 170K. After that, we got updates on Non-Farm Productivity, Unit Labor Costs, as well as Initial and Continuing Claims. Non-Farm Productivity was less bad than feared, falling 2.1% versus forecasts for a decline of 2.5%. Unit Labor Costs were a big bright spot as they only increased 4.2% compared to forecasts for an increase of 6.1%. Jobless claims, meanwhile, were slightly better than expected on both an initial and continuing basis.
We’re still not done yet, though. At 9:45 S&P Manufacturing PMI comes out at 9:45 followed by ISM Manufacturing and Construction Spending at 10 AM.
In Europe, stocks are higher this morning following some positive economic data as most manufacturing PMIs were modestly better than expected but still in contraction. Inflation data also came in lower than consensus forecasts with EU CPI unchanged in May versus expectations for an increase of 0.2%. With that, the y/y change fell to a 14-month low of 6.1% which was the lowest reading since February 2022.
In central bank news, ECB vice president Luis de Guindos noted that the central bank is in the ‘final stretch’ of the current rate-hiking cycle and that hikes in increments of 25 bps are ‘the new norm’. In comments earlier, ECB President Lagarde was more hawkish noting that there is no ‘clear evidence’ that underlying inflation has peaked, and added that she can’t say the ECB is satisfied with the inflation outlook.
It was a tale of many equity markets in May with the great (Nasdaq up 5.8%), the good (S&P 500 up 0.3%), the bad (Russell 2000 down 1.1%), and the ugly (Dow down 3.5%). Comparing the performance difference between the ‘great’ and the ‘ugly’ in May, the Nasdaq outperformed the Dow by 9.29 percentage points which ranks as the 9th widest margin of outperformance for the Nasdaq relative to the Dow in history.
The eight other months where the Nasdaq outperformed the Dow by more than it did in May all occurred in a 35-month span beginning in December 1998 and ending in October 2001. In fact, the Nasdaq outperformed the Dow by more than ten percentage points in back-to-back months twice (Dec 1998 to Jan 1999 and Nov 1999 to Dec 2000). If you think the Nasdaq is in a frenzy now, the period from late 1998 to the early 2000s makes it look like breakfast at Wimbledon.

Start a two-week trial to Bespoke Premium to read today’s full Morning Lineup.
Daily Sector Snapshot — 5/30/23
Chart of the Day – June Intramonth Seasonality
Bespoke’s Morning Lineup – 5/31/23 – Debt Deal Moves to the House
See what’s driving market performance around the world in today’s Morning Lineup. Bespoke’s Morning Lineup is the best way to start your trading day. Read it now by starting a two-week trial to Bespoke Premium. CLICK HERE to learn more and start your trial.
“These are the days that must happen to you.” – Walt Whitman
Below is a snippet of content from today’s Morning Lineup for Bespoke Premium members. Start a two-week trial to Bespoke Premium now to access the full report.
After opening right near their highs of the day and reversing lower throughout the trading day yesterday, equity futures are staring at a weak open this morning. Treasury yields are lower along with crude oil even as the debt ceiling deal moved out of Committee and is set for a full vote. Investors will be watching the Chicago PMI and JOLTS reports later this morning, but overnight, we had some weak economic data out of China and lower-than-expected inflation data out of Germany where the y/y increase in CPI dropped to 6.1% which was actually the lowest reading since last March. Some of these tech stocks have had a huge run in the last several days/weeks, so a pause should surprise no one.
The last 12 months haven’t been the best of times for crude oil, and the last two days have been no different. After a decline of nearly 4.5% to kick off the week yesterday, WTI is trading down over 2.5% this morning putting it within $1 of a 52-week low. A year ago, prices were coming off a peak of just over $130 per barrel after Russia invaded Ukraine but were still firmly in triple-digit territory. Bulls made another attempt to run crude back near the March 2022 high but came up short, and things only got worse from there. Since then, it’s been a steady march lower, and the price of a barrel of crude has nearly been cut in half.
For crude oil bulls, the last two months specifically have been a major disappointment especially when you consider the fact that China’s reopening was supposed to be a major catalyst. First, on 4/2, OPEC announced a surprise production cut. While the news caused a brief spike in prices, the rally stalled out right at the 200-day moving average (DMA) and prices were back at 52-week lows in a month. Then last week, a Saudi minister publicly noted that oil speculators who were betting against crude oil should ‘watch out’. In a bull market, those comments would have caused a buying frenzy, but in a bear market, jawboning has a very short half-life, and it wasn’t even enough to get WTI back above its 50-day moving average.

With crude failing its attempt to break above the 200-DMA back in April, the extended streak of closes below the 200-DMA has extended further. At 190 trading days through today, the current streak is the longest since the 427 trading day streak ending in April 2016. It would take nearly another year to challenge that streak, but the current streak already ranks as the fifth longest since 1984. Not only that but if the current streak lasts another month, it will move into third place overall.

Start a two-week trial to Bespoke Premium to read today’s full Morning Lineup.