Bespoke’s Morning Lineup – 12/26/25 – Quiet Post Christmas Friday
See what’s driving market performance around the world in today’s Morning Lineup. Bespoke’s Morning Lineup is the best way to start your trading day. Read it now by starting a two-week trial to Bespoke Premium. CLICK HERE to learn more and start your trial.
“Destiny is what you are supposed to do in life. Fate is what kicks you in the ass to make you do it.” – Henry Miller

Below is a snippet of commentary from today’s Morning Lineup. Start a two-week trial to Bespoke Premium to view the full report.
Good morning and happy Friday, on what is likely to be one of the most uneventful trading days this year. US equity futures are fractionally lower, treasury yields are little changed, and crude oil is slightly higher. The only area of the market with real activity is in gold and other metals. The yellow metal is up “only” 0.75% to $4,537 per ounce, but silver is up close to 4%, while Platinum is up double that, trading at 2,414.40 per ounce. On December 10, platinum closed at $ 1,647.50, and in the 16 days since then, it has rallied by 47%.
While it has been a quiet week for US equities, Asian markets haven’t been sleeping on Christmas. Overnight, the Nikkei rallied 0.7% to take its weekly gain to 2.5% while South Korea gained 0.5% for a total weekly gain of 2.7%. There was some welcome inflation news as Tokyo CPI slowed to 2.0% y/y and 2.3% y/y on a core basis. Despite that news, two-year JGB yields hit the highest level since 1996. In Europe, markets are even quieter than they are here as most countries remain closed for the Christmas holiday.
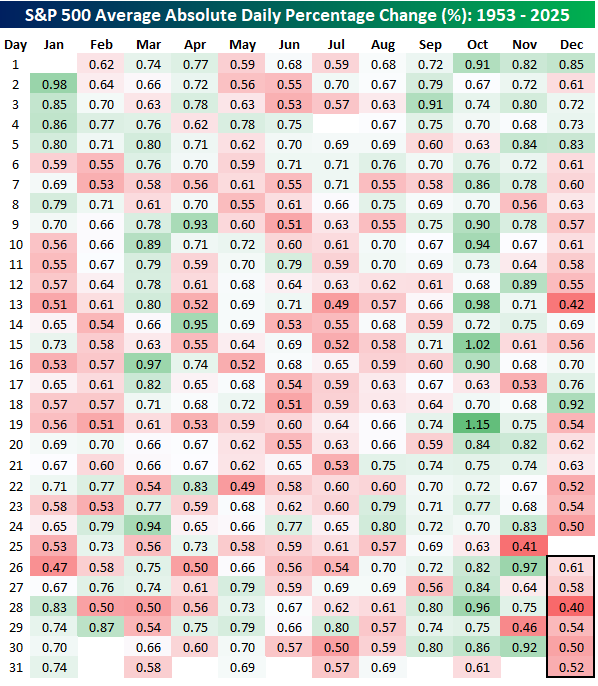
The S&P 500’s average daily move since 1953 has been up or down 0.67%, but that hasn’t been the case in the final week of December or the second half of the month, for that matter. The table below is like the one from our Chart of the Day from Tuesday (12/23), where we looked at the S&P 500’s average and median daily change for every day of the year. In this one, we show the S&P 500’s average daily percentage move (up or down) for every day of the year since 1953.
Volatility on the day after Christmas has been below average with an average daily move of 0.61%, but it still tends to be the most volatile day of the year between Christmas and year-end. The least volatile day of the week and the year, for that matter, is December 28th (0.40%). 12/28 falls on Sunday this year, but volatility on every day of the post-Christmas period is below the overall average. For December, volatility has been below average on 73% of all trading days, and the only month with more below average volatility days is July (80%). Conversely, October has the highest percentage of above average volatility days (87%).
The chart below shows the average absolute daily change for every day of the year (gray line) along with the 10-day moving average. We’re entering the final days of the year, and volatility is very low, but December 31st marks the low point of the year. From there, it will start to rise in the first few days of the new year. For much of the year, though, volatility tends to stick close to the average. The only real exceptions besides late December are mid-July, when volatility is also subdued, and then mid-March and October, when volatility starts to heat up. For now, though, it’s just cold!

Daily Sector Snapshot — 12/24/25
Chart of the Day: Prediction Markets on 2026
Bespoke’s Morning Lineup – 12/24/25 – Naughty May Be Nice
See what’s driving market performance around the world in today’s Morning Lineup. Bespoke’s Morning Lineup is the best way to start your trading day. Read it now by starting a two-week trial to Bespoke Premium. CLICK HERE to learn more and start your trial.
“One of the most glorious messes in the world is the mess created in the living room on Christmas day. Don’t clean it up too quickly.” – Andy Rooney
Below is a snippet of commentary from today’s Morning Lineup. Start a two-week trial to Bespoke Premium to view the full report.
Ahead of a holiday-shortened session (equities close for trading at 1 PM Eastern), US equities are in the Christmas mood this morning as futures are flashing shades of red and green. With the magnitude of the gains and losses being so small (less than 5 bps), futures on some of the indices are even alternating between red and green. Volume is very light, and while we could probably find a ‘reason’ for the modest moves up or down, besides jobless claims at 8:30, there’s nothing really going on.
The same can also be said for other areas of the financial markets, as the ten-year yield is down less than a basis point, crude oil is up fractionally, and bitcoin is down less than half of one percent. The only area of any movement this morning is in the metals space. While gold is up fractionally (but still above $4,500 per ounce), platinum, silver, and copper are all up at least 1.5%. If you own any of these metals, Merry Christmas indeed.
In Asia overnight, equity markets were mixed. The Nikkei traded down 0.1%, but China managed to trade 0.5% higher. In Europe, it’s very quiet this morning. Germany and Italy are already closed for Christmas, and the STOXX 600 is basically flat.
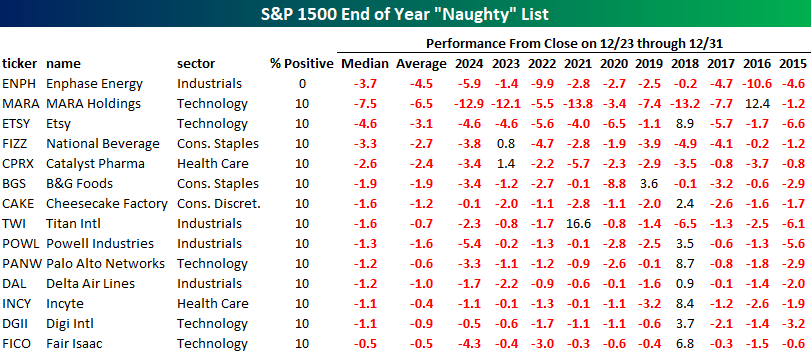
There’s been a lot of gains across financial markets this year, and for US stocks, equities typically also finish the year off with a positive bias. Not all stocks make the nice list, though. The table below shows the 14 stocks in the S&P 1500 that have historically traded lower from now through year-end over the last ten years, with declines at least 90% of the time.
At the top of the list, Enphase Energy (ENPH) has traded lower during this period for each of the last ten years, with a median decline of 3.7%. The remaining thirteen stocks on the list have traded down during this period in nine of the last ten years, and the worst performer of them all is bitcoin miner MARA Holdings (MARA). The stock’s median decline during this period has been 7.5%, including double-digit declines in each of the last two years. Other notable stocks on the list include Palo Alto Networks (PANW) and Delta Air Lines (DAL). All fourteen of these stocks can expect some coal in their stockings tomorrow morning.
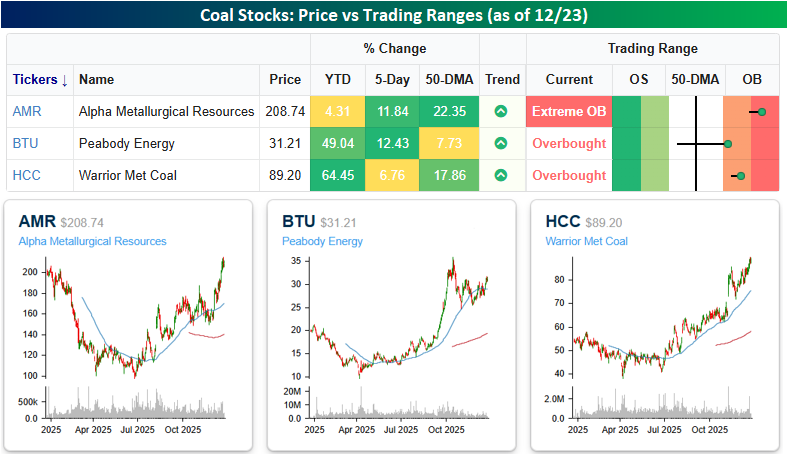
Getting coal in your stocking this year may not be the worst gift to get. Looking at the performance of the three major coal stocks this year, two are up at least 49%, while the biggest laggard – Alpha Metallurgical (AMR) is up over 10% in the last week and trading more than 22% above its 50-DMA. All three stocks are up at least 5% in the last week, suggesting that someone has been buying a lot of coal this week. Could it be Santa? Let’s hope not!
For all those who celebrate it, Merry Christmas, and for those who don’t, enjoy the day off!
The Closer – NIPA, AI & GDP, Durables – 12/23/25
Log-in here if you’re a member with access to the Closer.
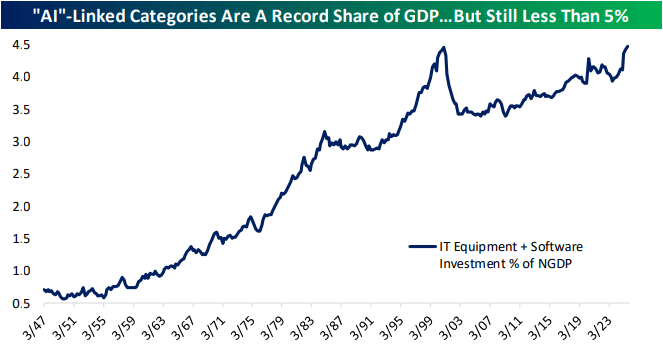
Looking for deeper insight into markets? In tonight’s Closer sent to Bespoke Institutional clients, we start out with an in depth look at the latest GDP figures including a dive into AI impacts on the number (pages 1-2) in addition to an update on some of the latest employment metrics according to ADP (page 3). We then turn over to an update to our Five Fed Manufacturing Composite (page 4) before closing out with a rundown of the latest durable goods figures (page 5).
See today’s full post-market Closer and everything else Bespoke publishes by starting a 14-day trial to Bespoke Institutional today!
Daily Sector Snapshot — 12/23/25
Bespoke’s 2025 Stat Sheet — Unique Market Insights Throughout the Year
We’ve put together a slide deck featuring some of our favorite stats published throughout the year. In this report we provide a month-by-month review of some of the most important and interesting market stats as they happened in real time, in bullet point format. Enjoy!
You can read our Bespoke Stat Sheet — 2025 by signing up for any of our three membership levels. Enter the coupon code “OUTLOOK” at checkout for a 20% discount on your first charge. You can review our membership levels here to help make your decision.
Bespoke Newsletter Monthly Payment Plan
Bespoke Newsletter Annual Payment Plan
Bespoke Premium Monthly Payment Plan
Bespoke Premium Annual Payment Plan
Bespoke All Access (Bespoke Institutional) Monthly Payment Plan
Bespoke All Access (Bespoke Institutional Annual Payment Plan
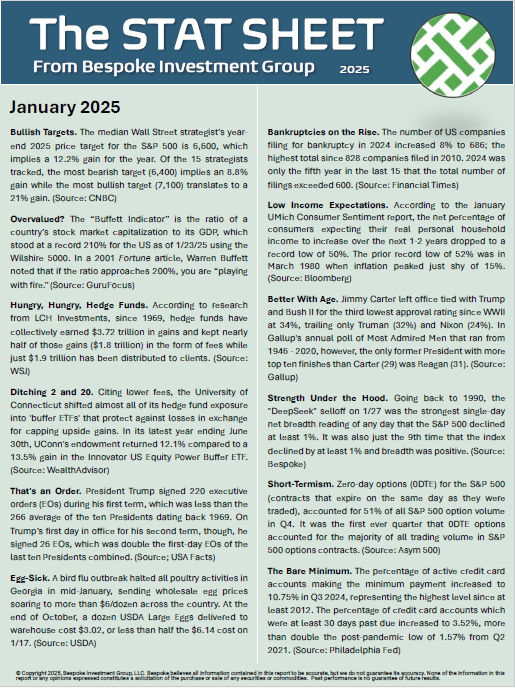
Chart of the Day – Merry Day After Christmas
Bespoke’s Morning Lineup – 12/23/25 – Divergent Commodities
See what’s driving market performance around the world in today’s Morning Lineup. Bespoke’s Morning Lineup is the best way to start your trading day. Read it now by starting a two-week trial to Bespoke Premium. CLICK HERE to learn more and start your trial.
“I got my start by giving myself a start.” – Madam C. J. Walker
Below is a snippet of commentary from today’s Morning Lineup. Start a two-week trial to Bespoke Premium to view the full report.
If you thought it was time to start slowing down for the Christmas and New Year’s holiday, you may want to wait a little longer. Between a backlog of economic data and various agencies looking to get a jump on the holidays, there’s a lot of economic data on the calendar this morning. At 8:30, we’ll get the first read of Q3 GDP, Personal Consumption, GDP Price Index, Core PCE, and Durable Goods. Then at 9:15, we’ll get Industrial Production and Capacity Utilization. At 10 AM Eastern, the Richmond Fed will release its monthly update on business activity in the region for December, and the Conference Board will release its monthly Consumer Confidence. Finally, at 1 PM, we’ll get the weekly Baker Hughes Rig Count, which is normally a Friday report – on a Tuesday.
Ahead of the data deluge, equity futures are little changed but with a positive bias. Treasury yields are lower, with the 10-year yield down 2 bps and just under 4.15%. For all the concerns that the latest round of rate cuts would push longer-term rates higher, it really hasn’t happened. In the commodities space, crude oil and natural gas are trading fractionally higher, while metals prices are all up by at least 1% yet again. Finally, Bitcoin, which was once the asset that just couldn’t go down, has turned into the one asset class that can’t get out of its way as it trades down by about 1% in the low $87,000 range.
In Asia overnight, major averages were little changed, and the Nikkei was up just 2 bps. Other major indices weren’t much more volatile, as South Korea was the big mover with a gain of 0.3%. In Europe, it’s a similar story as the STOXX 600 is up 0.2% as those markets are already slowing down for the Christmas holiday.
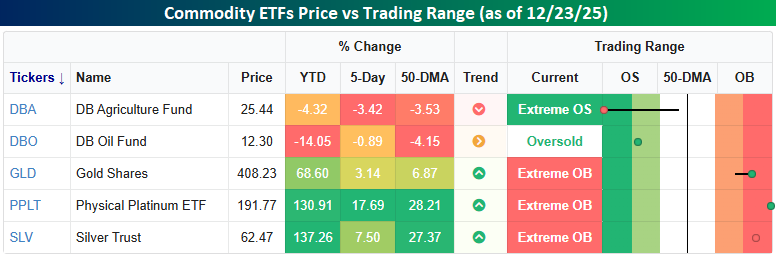
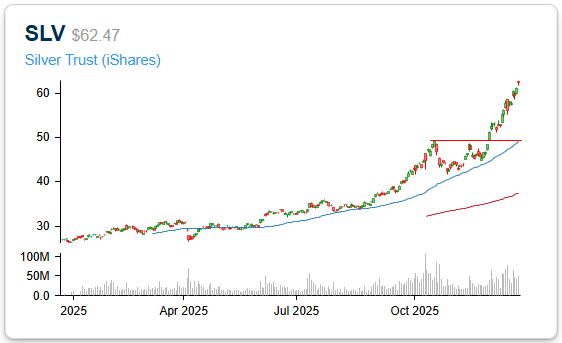
As mentioned above, metal prices are leading the gains in commodity prices this morning, which has essentially been the case all year. As shown in the snapshot from our Trend Analyzer below, anything commodity-related that doesn’t hurt when it’s dropped on your head hasn’t had much of a year in 2025. The DB Agriculture Fund is down 3.4% in the last week, taking its YTD decline to 4.3% and putting it in extreme oversold territory. Oil prices have also declined over the last week and are down over 10% on the year. Metals prices have gone parabolic, though. While gold is ‘only’ up 69%, Platinum (PPLT) and Silver (SLV) are up pretty much twice that!
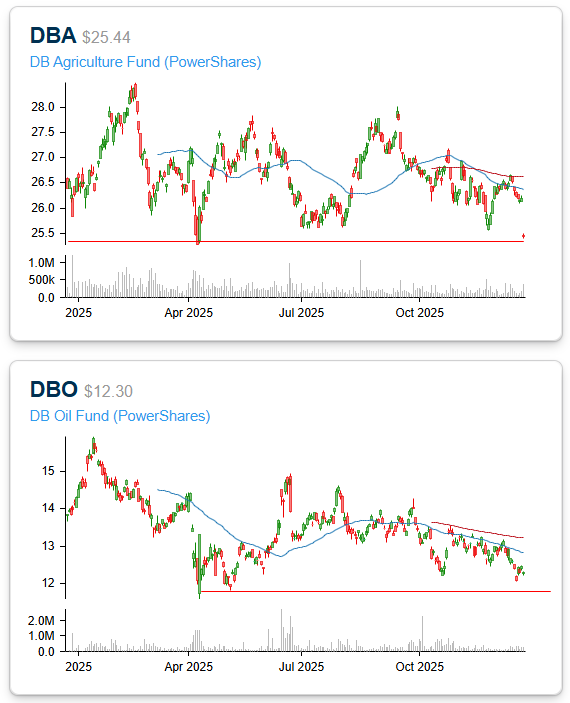
Below we show one-year charts of each of the five ETFs highlighted in the snapshot above. Starting with the soft commodities, DBA and DBO are both testing 52-week lows as we close out the year, although the weakness in DBA is a bit overstated, as yesterday’s decline was due to the ETF trading ex a 91-cent return of capital dividend. In any event, it hasn’t been a good year.
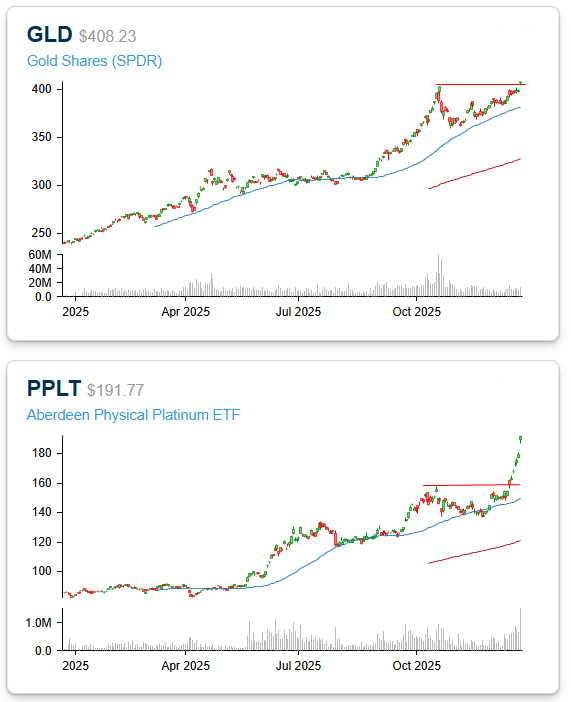
While the soft commodity ETFs are testing downside support, GLD broke above potential resistance at its late October high yesterday. Platinum and Silver were at similar junctures in the last few weeks, and once they finally broke out, they were off to the races. Will Gold follow?
The Closer – Commodity Recap, Treasury Allotment – 12/22/25
Log-in here if you’re a member with access to the Closer.
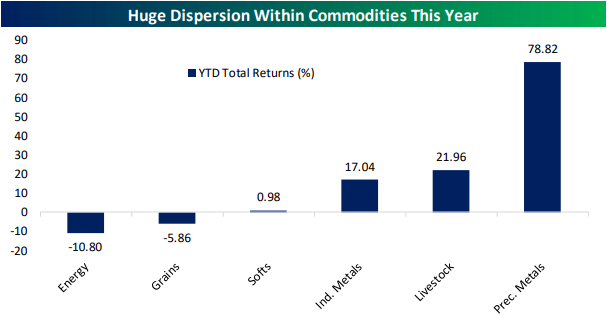
Looking for deeper insight into markets? In tonight’s Closer sent to Bespoke Institutional clients, as the year winds down to a close, we provide a recap of commodity performance in 2025 including looks at broad commodity indices (page 1), the dispersion between various commodities (page 2), and finally, energy, precious metal, and cattle prices (page 3). We round out tonight’s note with an update on Treasury allotment data (page 4).
See today’s full post-market Closer and everything else Bespoke publishes by starting a 14-day trial to Bespoke Institutional today!