Q1 2026 Earnings Conference Call Recaps: Nike (NKE)
Bespoke’s Conference Call Recaps use AI to summarize lengthy earnings calls. The commentary below is AI-generated and then edited by Bespoke for quality control. As always, none of these summaries should be construed as recommendations to buy or sell any securities, and investors should do their own research and/or consult with a financial professional before making any investment decisions.
Our latest recap available to Bespoke subscribers covers Nike’s (NKE) Q3 2026 earnings call.
![]()
Nike (NKE) designs, manufactures, and markets athletic footwear, apparel, and equipment across performance sports and lifestyle categories, serving athletes from elite professionals to everyday consumers. Nike is in the middle of a deliberate reset, sacrificing near-term growth to clean up inventory and rebuild a healthier, more profitable business. Running (+20%) and other performance categories are gaining traction, while sportswear remains a drag as the company works through excess product. Management is moving back toward wholesale, with North America showing clear improvement (wholesale +11%), but Greater China (-10%) and EMEA remain pressured by promotions and weaker traffic. Margins were hit by heavy discounting and about 300 bps of tariff impact, though Nike expects improvement later in 2027. Innovation remains a bright spot, with new platforms like Nike Mind selling out globally. NKE reported better-than-expected EPS and revenue, and cut guidance. Shares fell more than 15% on 4/1, the stock’s worst day in almost two years…
Continue reading our Conference Call Recap for NKE by becoming a Bespoke Institutional subscriber. You can sign up for Bespoke Institutional now and receive a 14-day trial to read our newest Conference Call Recap. To sign up, choose either the monthly or annual checkout link below:
Q4 2025 Earnings Conference Call Recaps: RH (RH)
Bespoke’s Conference Call Recaps use AI to summarize lengthy earnings calls. The commentary below is AI-generated and then edited by Bespoke for quality control. As always, none of these summaries should be construed as recommendations to buy or sell any securities, and investors should do their own research and/or consult with a financial professional before making any investment decisions.
Our latest recap available to Bespoke subscribers covers RH’s (RH) Q4 2025 earnings call.
![]()
RH (RH) is a luxury home furnishings brand that sells high-end furniture, lighting, textiles, and décor through immersive gallery stores that double as design hubs and hospitality venues. It’s less a retailer and more a luxury platform of product curation, interior design services, and in-store restaurants to target affluent and ultra-wealthy consumers, offering a window into high-end housing demand, discretionary spending, and global luxury trends. RH is leaning aggressively into a long-term growth strategy despite one of the weakest housing backdrops in decades, with management framing the current period as a rare overlap of peak investment and trough demand. The biggest near-term driver is the launch of RH Estates, targeting the roughly 60% of luxury homes with traditional architecture, which the company believes can become its largest and highest-margin business. At the same time, RH is investing heavily in Europe (Paris, Milan, London) to build brand awareness before expanding into higher-volume suburban markets. Margins are under pressure from this investment cycle and tariff-driven supply chain disruption (RH has had to re-source about 40% of its assortment), but management expects significant operating leverage as capex falls from about $300M toward $150M annually. Longer term, RH is betting on structural tailwinds, including a $30T–$38T wealth transfer and rising multi-home ownership among ultra-wealthy consumers. Shares tumbled 19.3% on 4/1 after cutting guidance and recording EPS and revenue misses…
Continue reading our Conference Call Recap for RH by becoming a Bespoke Institutional subscriber. You can sign up for Bespoke Institutional now and receive a 14-day trial to read our newest Conference Call Recap. To sign up, choose either the monthly or annual checkout link below:
One Year Liberated
One year ago today after the markets closed on 4/2/25, President Trump made an appearance in the Rose Garden of the White House. At the event, which he labeled as “liberation day,” the President announced a slew of new reciprocal tariff rates on countries all around the globe. The tariff rates ranged from a baseline of 10% on all imports upwards of 100% on some specific countries such as China. Headed into the announcement, the S&P 500 had already fallen 7.7% versus its 2/29/25 high, but over the next several days, the index fell another 12.4% through the 4/8/25 low (for a total decline from February’s high to April’s low of 18.9%). While equity markets took a big hit last spring, the S&P 500 made a full recovery by June and are now up solidly over the past year.
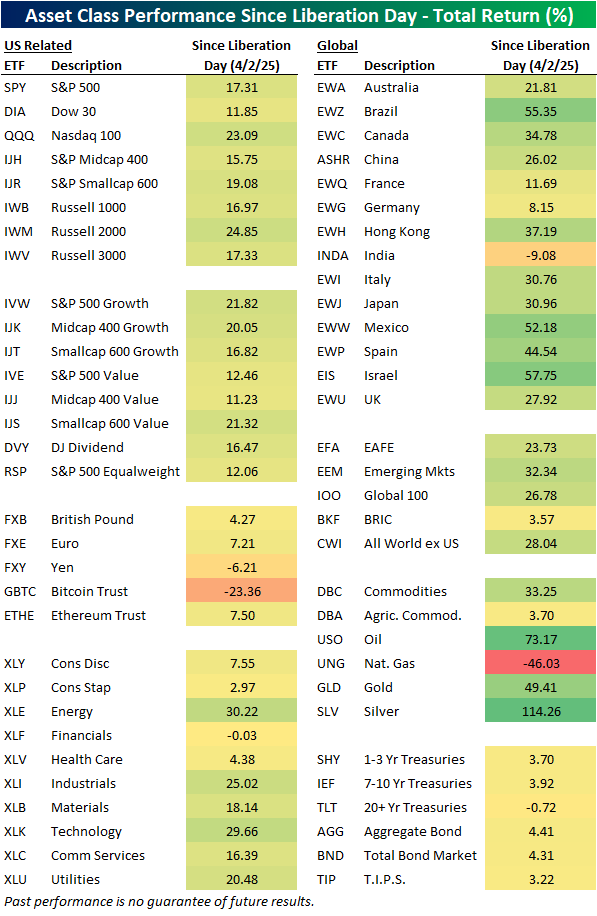
Below we show our asset class performance matrix with total returns for a range of ETFs since liberation day.
The biggest winners have been in the commodity space. Silver (SLV) is up 114% and that is even after falling 38% from its January high. Oil (USO) has been the next best performer with a 73% gain.
As for equities, the S&P 500 (SPY) has provided a 17.3% total return in the past year. The small cap indices like the S&P Smallcap 600 (IJR) and Russell 2,000 (IWM) have outperformed with gains of 19.1% and 24.9%, respectively. While small caps have provided larger total returns than large caps, large cap growth (IVW) and small cap value (IJS) are up similar degrees.
International equity ETFs have broadly outperformed US indices with the likes of Brazil (EWZ), Mexico (EWW), and Israel (EIS) all up well over 50%. Only one country ETF is lower in the past year: India (INDA) with a 9.1% decline. Germany (EWG) and France (EWQ) are the only two other country ETFs in our matrix to underperform the S&P 500.
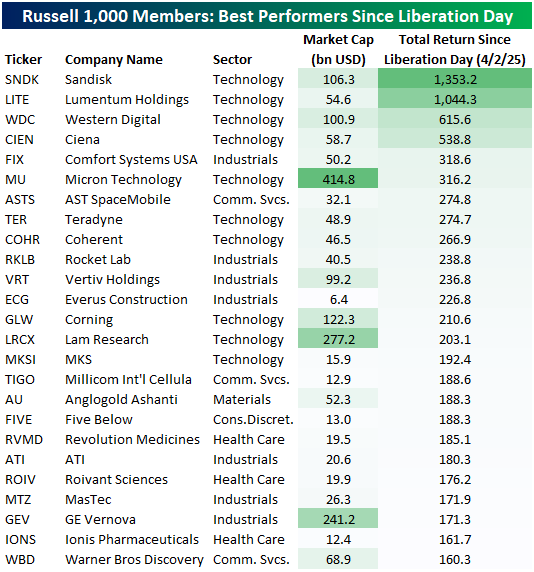
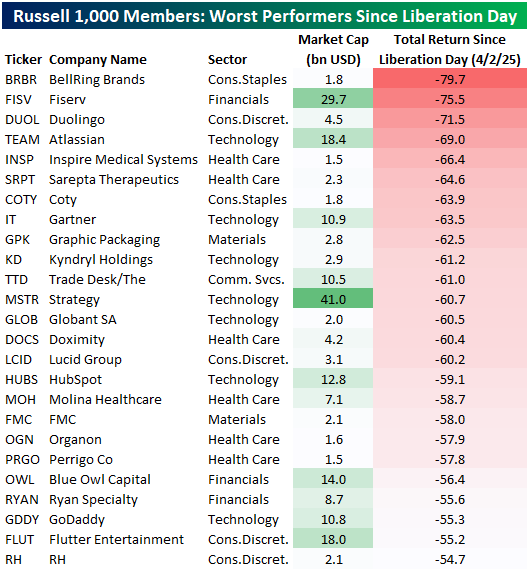
Moving back to look at the US, in the tables below we show the Russell 1,000 members that have provided the best and worst total returns over the past year. For the biggest winners, we have two 10-baggers in memory chip maker Sandisk (SNDK) and optical and photonic product maker Lumentum (LITE). SNDK is by far the biggest winner even of those two, up 1,353%. Not far behind SNDK and LITE are two more AI Infrastructure stocks: Western Digital (WDC) and Ciena (CIEN). Many of these top performing stocks are plays on AI buildouts, however, there are some other stocks from other parts of the market such as Warner Bros Discovery (WBD), GE Veranova (GEV), and Five Below (FIVE).
Turning over to the other end of the spectrum, the Russell 1,000 currently has 36 members that are down over 50% in the past year. Of those, the biggest loser is nutrition company BellRing Brands (BRBR), which has fallen close to 80%. Fintech firm Fiserv (FISV) and language learning company Duolingo (DUOL) are the only others down more than 70%.
Like this analysis? Join our premium members by starting a trial today! Click below for details on how to sign up:

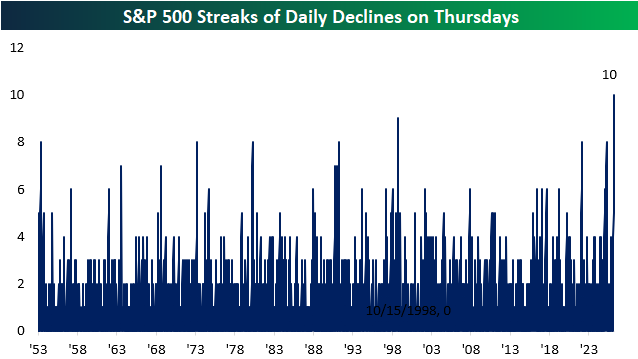
In the Throes of Thursdays
The S&P 500 is currently on pace to close lower for the 10th consecutive Thursday, which would be a record Thursday losing streak going back to 1953 (when the current five-day trading week was put in place by the NYSE).
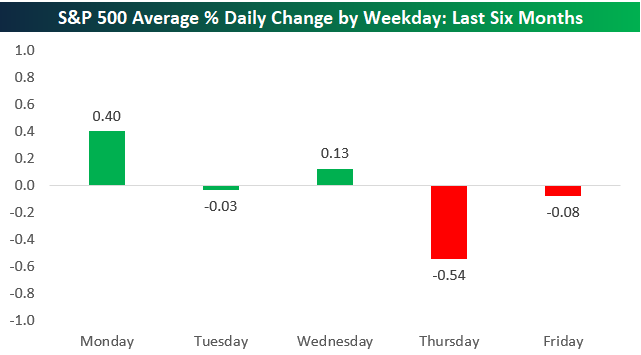
Over the last six months, the S&P 500 has averaged a decline of 0.54% on Thursdays, which is by far the worst of any weekday. As shown below, Friday is the only other weekday that has averaged a decline (-0.08%), while each of the first three trading days of the week have actually averaged gains.
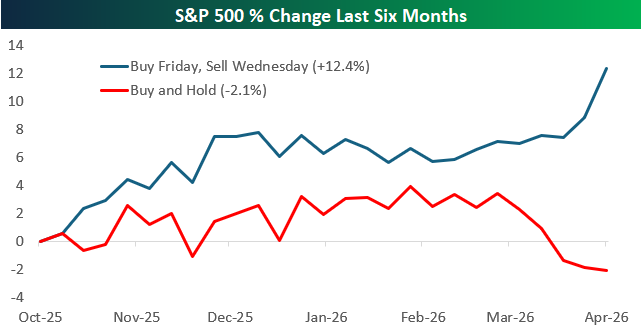
Hypothetically, had you only owned the S&P 500 through the first three days of the week over the last six months (buy at the close on Friday and sell at the close on Wednesday), you’d be sitting on a nice 12.4% gain right now versus a decline of 2.1% for buy and hold.
As always, past performance is no guarantee of future results.
Like this analysis? Join our premium members by starting a trial today! Click below for details on how to sign up:
Bespoke’s Morning Lineup – 4/2/26 – That Didn’t Go As Expected
See what’s driving market performance around the world in today’s Morning Lineup. Bespoke’s Morning Lineup is the best way to start your trading day. Read it now by starting a two-week trial to Bespoke Premium. CLICK HERE to learn more and start your trial.
“The more wonderful the means of communication, the more trivial, tawdry, or depressing its contents seemed to be.” – Arthur C Clarke, 2001: A Space Odyssey

Below is a snippet of commentary from today’s Morning Lineup. Start a two-week trial to Bespoke Premium to view the full report.
Leading up to last night’s national address from the President, there was some optimism that he would lay out a path of ending the hostilities and/or reopening the Strait of Hormuz. We got neither. Instead, the speech was more just a reheating of leftover talking points from the last few weeks.
The market response was as you would expect. Equity futures are sharply lower. The S&P 500 and Nasdaq are both indicated to open down by at least 1.5%. Treasury yields are higher, with the 10-year yield up 3 bps to 4.352%. The big move is in oil markets, though, as WTI is trading up more than 9.5%, which would be one of the largest one-day gains since the war started! Gold prices are sharply lower with a decline of close to 4%, while Bitcoin is also 3% lower. With a three-day weekend looming and an incredibly large (and increasing) presence of US military assets in the Middle East, you can’t blame someone for not wanting to take too much risk ahead of the weekend.
In international markets, Asia was sharply lower, with the Nikkei down over 2% while South Korea tanked over 4%. European markets are all down at least 1%, continuing the trend of weakness we have seen since the President’s speech started at 9:02 Eastern last night.
The last two days of trading were a relief for bulls after the weakness of the last few weeks. As the chart of the Nasdaq below illustrates, though, the gains have done little at this point to break the downtrend that has been in place for the last several weeks. Mornings like today serve as a reminder of that. It’s also hard not to blame investors for being more cautious ahead of a three-day weekend, just as the President threatens in a national address to bomb Iran back to the Stone Age.
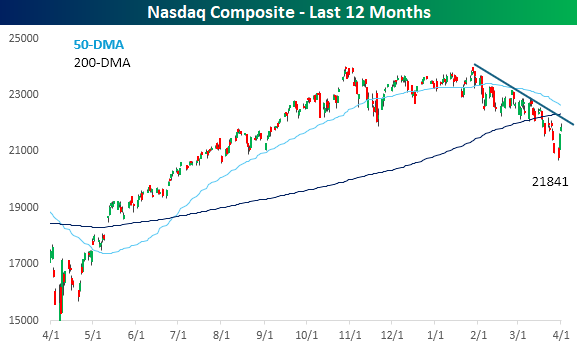
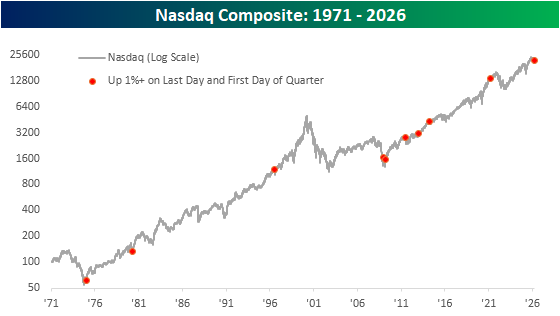
What was notable about the last two trading days was that the Nasdaq ended Q1 and started Q2 with gains of at least 1% on each trading day. The quarter-end gains were easily attributable to relancing, but gains to start a quarter tend to indicate actual inflows, which is a positive. Since the Nasdaq’s inception in 1971, the last two days were only the 10th time that the index gained at least 1% on the last day of a quarter and subsequently the first trading day of the next quarter.
The long-term chart of the Nasdaq below shows each occurrence, and they didn’t occur during the early stages of market downturns.
The Closer – Trend Test, ISM, Home Loans – 4/1/26
Log-in here if you’re a member with access to the Closer.
- Short term trends were tested today for the Nasdaq, mega-cap Tech, the VIX, and the dollar.
- The ISM Manufacturing index hit a new high for the cycle with underlying indices rising sharply.
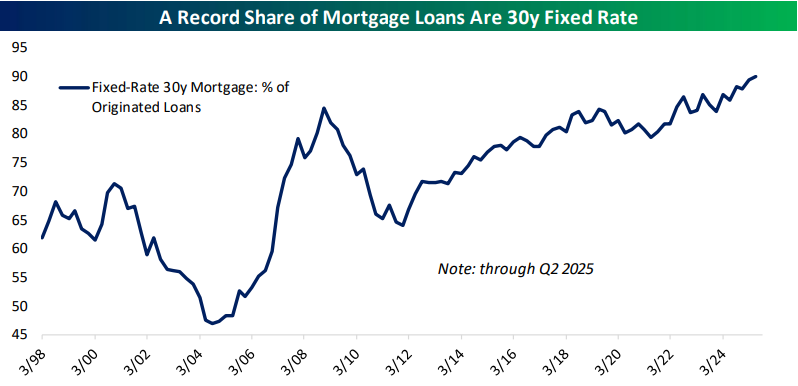
- A record share of home loans are now 30-year fixed rate.
See today’s full post-market Closer and everything else Bespoke publishes by starting a 14-day trial to Bespoke Institutional today!
Daily Sector Snapshot — 4/1/26
Chart of the Day – Energy Ends at 14?
Q1 2026 Recap
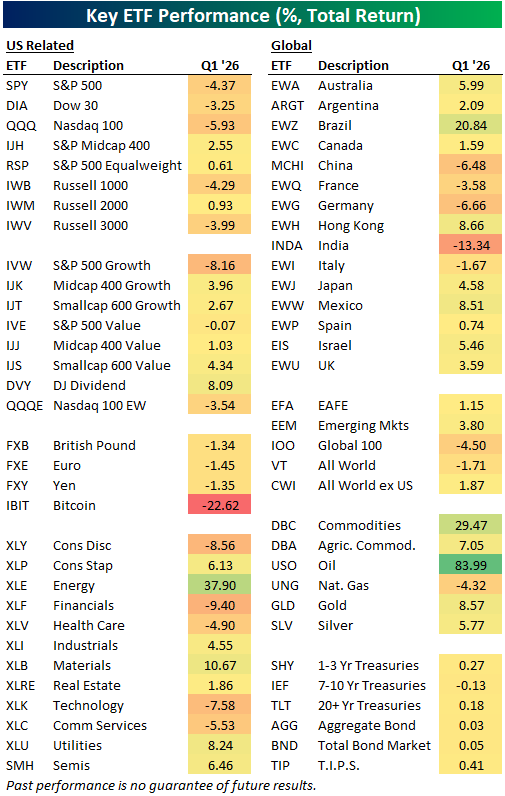
An eventful first quarter is now in the books. In the table below, we show the total return for a range of ETFs across various parts of the equity market (both domestic and international) in addition to other asset classes.
Unsurprisingly, the single largest gain in Q1 came from oil as USO surged 84%. The next best returns were related to oil with the Energy sector (XLE) up 37.9% and broad commodities (DBC) gaining 29.5%. Elsewhere in commodities, gold (GLD) and silver (SLV), in addition to ags (DBA) all rose mid to high single digits. While gold was higher, “digital gold”, or Bitcoin (IBIT), had a rough quarter, falling 22.6%; the worst return of any asset in the matrix.
Turning to equities, the S&P 500 (SPY) fell 4.4%, but the equal weight version of the index (RSP) managed to gain 0.61%. Sector performance was mixed. Again, Energy saw a huge gain as did Materials (XLB), up 10.67%. Other more lightweight sectors like Consumer Staples (XLP), Industrials (XLI), and Real Estate (XLRE) were also higher.
On the downside, some of the more heavyweight areas like Tech (XLK), Consumer Discretionary (XLY), and Financials (XLF) all fell more than 7%. Large caps underperformed small and mid-caps and growth underperformed value. Internationally, most countries saw gains with the largest coming from Brazil (EWZ) as it gained over 20%. Meanwhile, India (INDA) fell the most with a 13.3% drop. China (MCHI), France (EWQ), Germany (EWG), and Italy (EWI) all fell in Q1 as well.
Looking at individual stocks, the Russell 1,000 had less than half of the index move higher in Q1 with the average stock falling 0.29%.
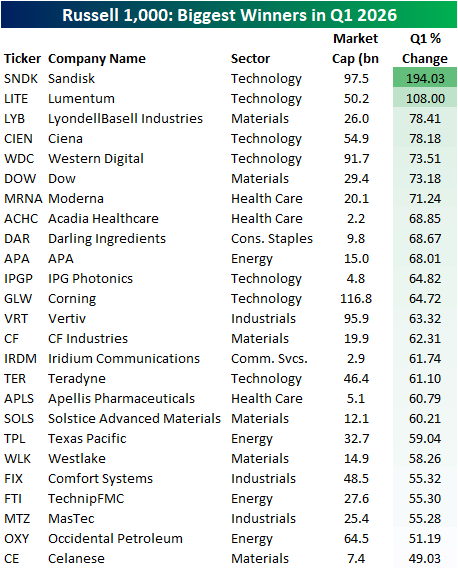
In the table below, we show the 25 top performers in the index during the quarter.
Memory stock Sandisk (SNDK) topped the list with a 194% gain as AI demand continues to bolster that industry. Another AI story that drove a 100%+ gain in Q1 was optical and photonic product manufacturer Lumentum (LITE), who also secured a $2 billion investment from NVIDIA (NVDA) in early March.
A similar name is Ciena (CIEN), which came in at the number four spot with a 78% gain. After the surge in energy prices in March, a number of Energy stocks also top the list like APA (APA), Texas Pacific (TPL), and T TechnipFMC (FTI). Fertilizer manufacturer CF Industries (CF) is also a major winner of the post conflict period, landing it in the best performers with a 32% gain.
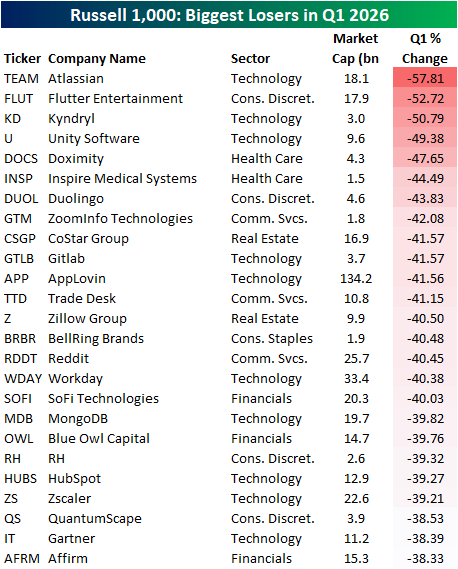
Turning to the quarter’s biggest losers, there were three names that got cut in half: Atlassian (TEAM), Flutter Entertainment (FLUT), and Kyndryl (KD). Two of these are software stocks (TEAM, KD) in the crosshairs of the “AI Doom” trade where investors are worried about business obsolescence, while Flutter owns betting-app FanDuel and is now down 66% from all-time highs made last August.
Like this analysis? Join our premium members by starting a trial today! Click below for details on how to sign up: