Bespoke’s 2026 Investor Sentiment Report
In mid-December, we sent Bespoke’s client base a survey to capture the current thinking of experienced investors on markets, the economy, policy shifts, and portfolio positioning heading into 2026 and beyond. This report is a detailed summary of the results from that survey. Thank you to those that took part!
You can read our 2026 Investor Sentiment report by signing up for any of our three membership levels below. Enter the coupon code “OUTLOOK” at checkout for a 20% discount on your first charge. You can review our membership levels here to help make your decision.
Bespoke Newsletter Monthly Payment Plan
Bespoke Newsletter Annual Payment Plan
Bespoke Premium Monthly Payment Plan
Bespoke Premium Annual Payment Plan
Bespoke All Access (Bespoke Institutional) Monthly Payment Plan
Bespoke All Access (Bespoke Institutional Annual Payment Plan
Chart of the Day – Strategist Targets for 2026
Bespoke’s Morning Lineup – 1/2/26 – New Year, Same Surprises
See what’s driving market performance around the world in today’s Morning Lineup. Bespoke’s Morning Lineup is the best way to start your trading day. Read it now by starting a two-week trial to Bespoke Premium. CLICK HERE to learn more and start your trial.
“The only true wisdom is in knowing you know nothing.” – Socrates

Below is a snippet of commentary from today’s Morning Lineup. Start a two-week trial to Bespoke Premium to view the full report.
As we approached the turn of the calendar, December was flooded with market outlooks for the year ahead, which always present the reader with highly confident expectations for the year ahead. Reading through most of them, the blueprint for the year ahead looks certain – solid earnings growth, two to three rate cuts, higher but stable inflation, and steady economic growth. It’s almost as though the outcome for 2026 has been pre-ordained. If only life were that simple.
All you had to do was watch last night’s Ole Miss/Georgia game to be reminded that even when everyone thinks they know what’s “going” to happen, it’s not uncommon for the opposite to play out. In the week leading up to last night’s game, prediction markets were giving Ole Miss less than a one in three chance of winning. After the game started, the odds for Ole Miss got worse, falling below 20% for much of the game. When the game finally ended just before midnight, though, it was Ole Miss on top by a score of 39-34. Whether it’s in sports, your personal life, or the markets, just because everyone seems to agree on what’s going to happen doesn’t mean that’s what will play out. Expect surprises.
After the weakness to close out 2025, investors are probably surprised to see futures looking so strong this morning. S&P 500 futures are pointing to a 0.57% gain to start the year, while the Nasdaq is on pace for a 1% gain. The 10-year yield is little changed at 4.15% while crude oil is down fractionally at just above $57 per barrel. After a volatile end to 2025, metals have picked up right where they left off last year, but this time on a positive note. Gold is up over 1%, while silver and platinum are up over 4% each.
In Asia, Japan and China were closed, but other major indices in the region traded on a positive note, with Hong Kong up 2.8% and South Korea jumping 2.3%. The only economic indicator of note in the region was South Korea’s manufacturing PMI, which moved slightly back into expansionary territory at a level of 50.1.
European stocks are also positive this morning, with the STOXX 600 up 0.5%, led higher by Italy and Spain with gains of 0.6% each. The gains come despite generally weaker than expected manufacturing PMI readings for the region, where the Eurozone slid further into contraction, and Germany’s reading fell from 48.2 to 47.0.
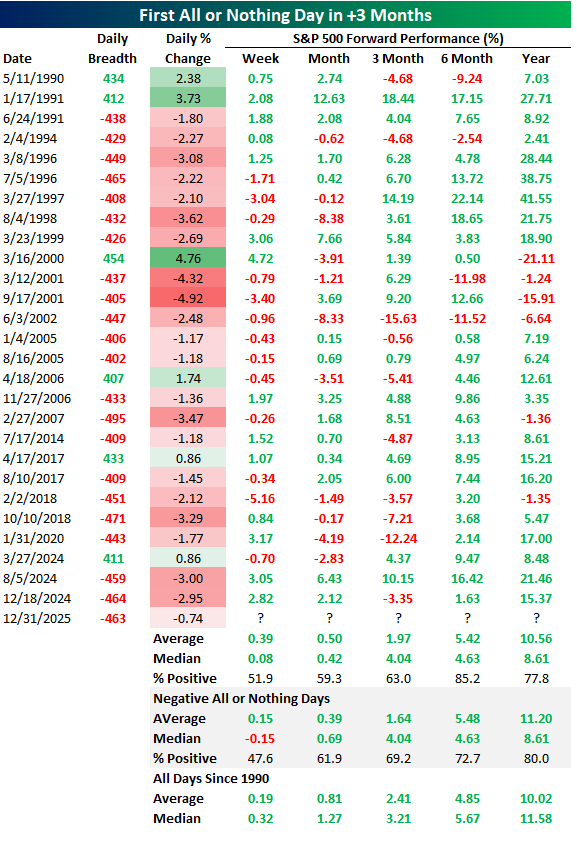
While futures are higher to kick off 2026, 2025 ended like a 500-pound bag of rocks, or more accurately, 482 rocks. The S&P 500 dropped 0.74%, which wasn’t the worst decline considering breadth was exceptionally bad with 482 index members declining versus only 19 rising. We consider an all-or-nothing day when breadth is +/-400, meaning at least 90% of the S&P 500’s constituents rose or fell. Wednesday was the first all-or-nothing day since July 15, when net breadth was -404. As shown in the table below, the first all-or-nothing day in at least three months has typically been followed by gains, but not particularly stronger or weaker than the long-term average. That’s also the case when the first day in at least three months is a ‘nothing’ day like Wednesday was. With that said, in the near term (one week and one month), median returns have been a little bit weaker than all periods after those instances.
Daily Sector Snapshot — 12/31/25
Buffett Exits Stage Left
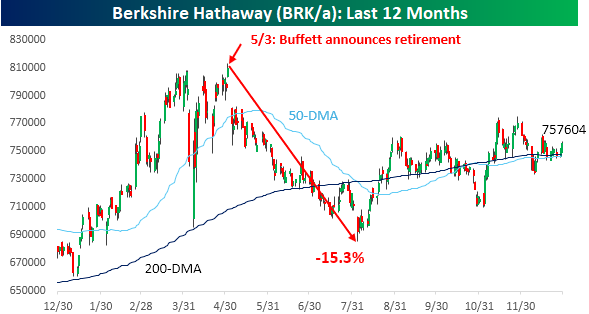
After over 55 years at the helm of Berkshire Hathaway (BRK/a), Warren Buffett will hand over control of the company he cobbled together to Greg Abel, ending an era of one of the most successful investment careers the world has ever known. Markets have known about this transition for just under seven months now, so the stock has had time to adjust to life without the cherry-coke drinking CEO.
As shown in the chart below, when Buffett announced the transition at the annual meeting in May, the stock had closed at a record high the Friday before. When markets reopened the following Monday, the stock gapped lower and kept going down for the next three months, falling a total of 15.3%. The stock has since erased about half of those losses, but it remains well below its all-time high of $81,000 even as the S&P 500 closes out the year close to fresh highs.
Markets are forward-looking, but Buffett’s announcement in early May obviously caught the market off guard. While the announcement was a surprise, the fact that Buffett is in his mid-nineties and had just recently lost his long-time business partner, Charlie Munger, should have at least had the market starting to price in life without Buffett.
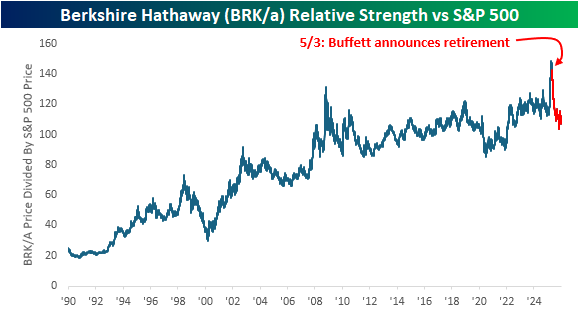
The reversal in Berkshire stock since Buffett made his retirement announcement is even more evident in terms of the stock’s relative strength versus the S&P 500. From 1990 through late 2008, the stock steadily outperformed the S&P 500 outside of a brief two-year period in the late 1990s during the dot-com bubble. After its peak relative strength reading in 2008, Berkshire basically moved sideways on a relative basis versus the market.
Earlier this year, the stock experienced a huge surge relative to the market during the tariff-tantrum and appeared on the verge of a new leg higher in relative strength. However, a combination of the market recovery and Buffett’s surprise announcement quickly reversed that strength.
The last time the stock’s relative strength versus the S&P 500 spiked in late 2008 and then quickly pulled back, it didn’t see those levels again for more than 15 years. With this latest reversal, will it take another 15 years before the stock makes another relative strength all-time high, or will the new CEO prove to be ready, willing and ‘Abel’ to lead the company in its next act?
Not a Bespoke client? We’d love for you to give our equity research platform, Bespoke Premium, a try. You can sign up for complimentary access for 14 days at this link to start receiving our daily emails today!

Chart of the Day – 2025 Decile Review
Bespoke’s Morning Lineup – 12/31/25 – The End
See what’s driving market performance around the world in today’s Morning Lineup. Bespoke’s Morning Lineup is the best way to start your trading day. Read it now by starting a two-week trial to Bespoke Premium. CLICK HERE to learn more and start your trial.
“For eleven months and maybe about twenty days each year, we concentrate upon the shortcomings of others, but for a few days at the turn of the New Year we look at our own. It is a good habit.” – Arthur Hays Sulzberger
Below is a snippet of commentary from today’s Morning Lineup. Start a two-week trial to Bespoke Premium to view the full report.
We made it (almost) through another year. Regardless of your political leanings, one thing we can all probably agree on is that with Trump as President, there’s never a dull moment. It was true in his first term, and the first year of his second term has proved no different. For all the uncertainty and volatility this year, though, it’s ironic to think that the VIX is closing out 2025 at under 15 and not far from its lows of the year!
Futures are lower this morning, with the S&P 500 indicated to open 0.21% lower while the Nasdaq is down 0.30%. A decline today would make it four straight days of declines to close out the year. Despite the gains for the year, 2025 is going out with a whimper.
Outside of equities, the 10-year US Treasury yield is down 2 bps to 4.1% while crude oil is fractionally higher. While most areas of the financial markets are quiet today, the real action is in metals, where the CME has lifted margin requirements for the second time in a week! Gold is down 1.6%, while silver is down over 8% and platinum is sinking over 10%. Silver is on pace for its fourth straight day of 7.5% daily moves, while platinum has had four straight 5%+ daily moves.
In Asia overnight, the Nikkei was closed, but most other indices in the region finished the last trading day of the year higher as China’s manufacturing PMI moved slightly back into expansionary territory (50.1) and came in higher than expected. In Europe, the tone is less positive this morning as the STOXX 600 trades down 0.2% in a session where many countries are closed for trading, and those that are open will close early. Technology is leading the losses with a decline of 0.6%.
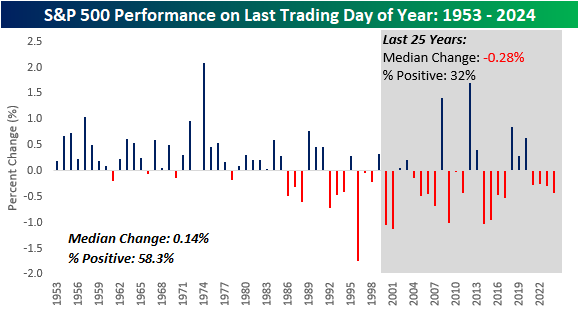
Equities are on pace to close out the last session of the year with losses, and that’s a trend that has become increasingly common in recent years. The chart below shows the S&P 500’s historical performance on the last trading day of the year since 1953. The S&P 500’s median performance has been a gain of 0.14% with positive returns 58.3% of the time.
While the long-term performance has been positive, more recent returns have been weaker. If the S&P 500 finishes lower today, it would be the fifth straight year that the index traded lower on the last session of the year, and that would be the longest streak since at least 1953. Besides just the last four years, though, the pattern of the last trading day of the year has been lower. Since 2000, the S&P 500’s median change on the last trading day of the year has been a decline of 0.28%, with gains less than a third of the time. If there’s any consolation for bulls, in years when the S&P 500 was up over 15% YTD heading into the final session of the year, the median gain on the final day has been a gain of 0.29%, with gains 64% of the time, while in all other years, the median gain was just 0.5%.
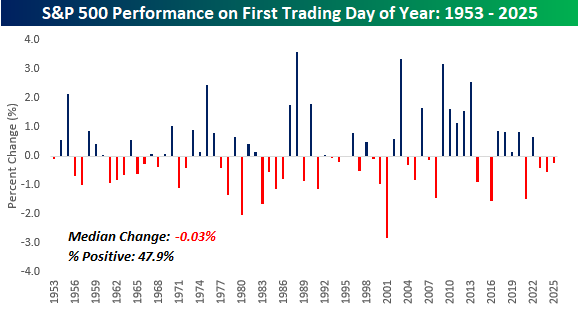
When we turn the calendar to 2026 on Friday, market performance on the first trading day of the year hasn’t been great either. Since 1953, the S&P 500’s median change to start a new year was a decline of 0.3% with gains just under half of the time. The equity market has also traded lower on the first trading day of the year in each of the last three years and four of the last five. Maybe the best idea is to take off until Monday!
The Closer – Fixed Income Year in Review, Inside After Outside – 12/30/25
Log-in here if you’re a member with access to the Closer.
Looking for deeper insight into markets? In tonight’s Closer sent to Bespoke Institutional clients, we begin with a recap of fixed income markets in 2025 (pages 1 – 4). We then show the lack of volatility in today’s session (page 5) before closing out with an update on home prices and the Dallas Fed’s service activity data (page 6).
See today’s full post-market Closer and everything else Bespoke publishes by starting a 14-day trial to Bespoke Institutional today!
2025 Triple Plays “Kings”
Along with our 2025 Stat Sheet and our 2026 Annual Outlook highlighting the pros and cons for the US equity market heading into the new year, we’ve also published a new Triple Play Report featuring the stocks that reported the most earnings triple plays in 2025.
Roughly 8% of the 8,000+ quarterly earnings reports from stocks this year were “triple plays.” What is a triple play? When a stock reports quarterly earnings, it registers a “triple play” when it beats analyst EPS estimates, beats analyst revenue estimates, and raises forward guidance. We coined the term back in the mid-2000s, and you can read more about it at Investopedia.com.
Of the more than 400 stocks that reported earnings triple plays this year, there were just 15 that reported triple plays on all four of their quarterly reports in 2025. We take a look at triple-play trends in 2025 and discuss each of the 15 stocks that reported four triple plays this year in this report.
You can read our 2025 Triple Play “Kings” report and our 2026 outlook pieces by signing up for any of our three membership levels. Enter the coupon code “OUTLOOK” at checkout for a 20% discount on your first charge. You can review our membership levels here to help make your decision.
Bespoke Newsletter Monthly Payment Plan
Bespoke Newsletter Annual Payment Plan
Bespoke Premium Monthly Payment Plan
Bespoke Premium Annual Payment Plan
Bespoke All Access (Bespoke Institutional) Monthly Payment Plan
Bespoke All Access (Bespoke Institutional Annual Payment Plan
