The Closer – Memory & Tokens, AI Chart Check – 5/26/26
Log-in here if you’re a member with access to the Closer.
- DRAM prices and GPU rental rates have continued to rise, powering the AI trade.
- AI related stocks have posted consistent gains recently with many of those names reaching new highs.
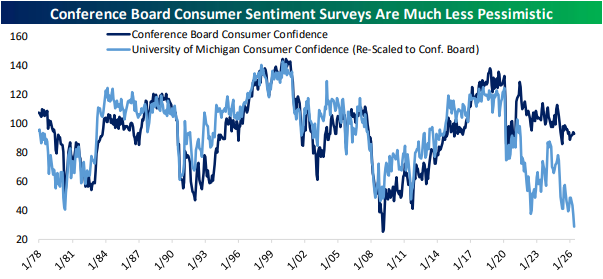
- Separate surveys tracking consumer confidence are showing drastically different results including a record low for UMich and more tempered readings for the Conference Board.
See today’s full post-market Closer and everything else Bespoke publishes by starting a 14-day trial to Bespoke Institutional today!
Daily Sector Snapshot — 5/26/26
The Trillionaires Gain a New Member
The S&P 500 is on pace to close at fresh record highs today on positive breadth. Once again, it is the AI trade powering the move as several of the index’s biggest gainers are out of the semiconductor space.
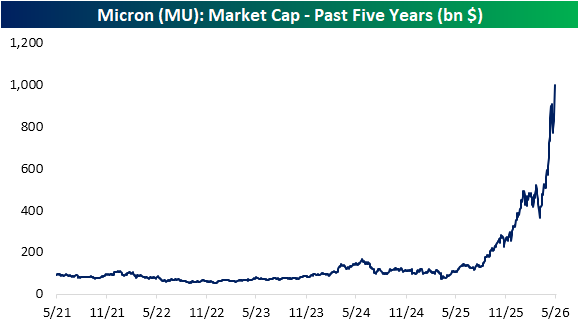
The single biggest gainer, up over 19% as of this writing, is Micron (MU).
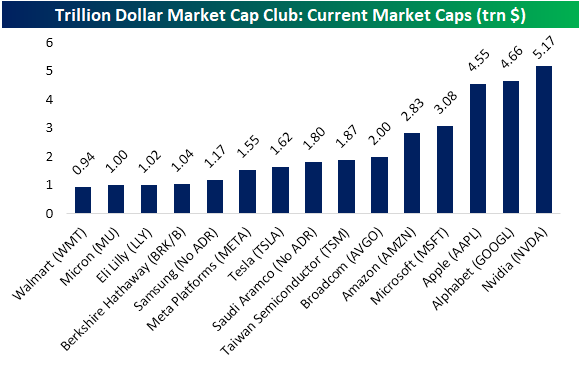
An upgrade by UBS that saw a tripling of MU’s price target is being deemed the catalyst for today’s surge in the memory and data storage producer, and that is enough to also lift it above a $1 trillion market cap for the first time.
A year ago, MU’s market cap was just $100 billion, and it was at $62 billion when ChatGPT was released in late 2022.
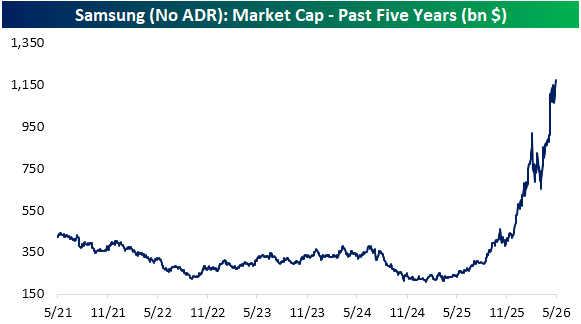
MU is not the only memory chip maker to reach a $1 trillion market cap. On a US dollar-adjusted basis, Samsung, which trades in South Korea, eclipsed that threshold for the first time on May 6th.
Looking at other stocks with market caps above $1 trillion, Eli Lilly (LLY) has also re-joined the club.
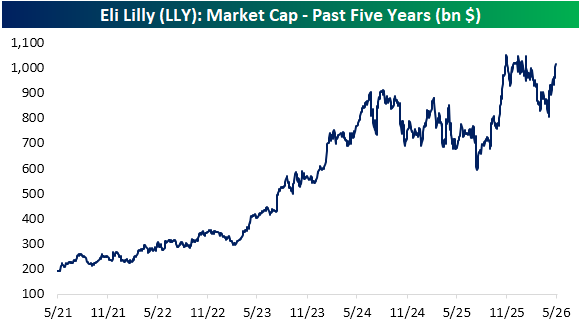
With the addition of MU, there have now been 15 US and international stocks to hit the $1 trillion threshold (shown below).
Want more from Bespoke? You can start by joining our Think BIG mailing list where you’ll receive an interesting market stat in your inbox a few times per week. All we need is your email address. Join now by clicking here or on the image below.

Mega-Cap AI Mentions on Earnings Calls
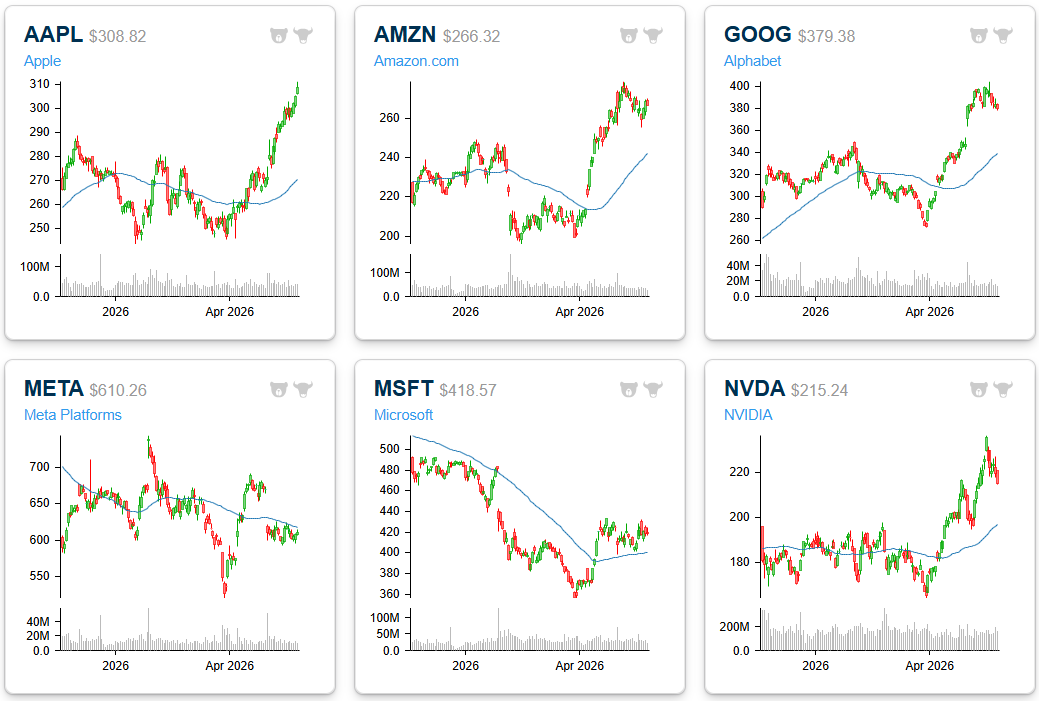
Below is a look at six-month price charts for six mega-caps that we’ve been monitoring closely since the AI Boom began with ChatGPT’s release in late 2022.
Apple (AAPL) has recently been the best performer in the group, with a surge above $300/share, while Amazon (AMZN), Alphabet (GOOG), and NVIDIA (NVDA) have recently pulled back a bit in the last couple of weeks after making fresh highs earlier in the month.
Meta (META) and Microsoft (MSFT) are two of the six names that still have a lot of work to do before reaching new highs.
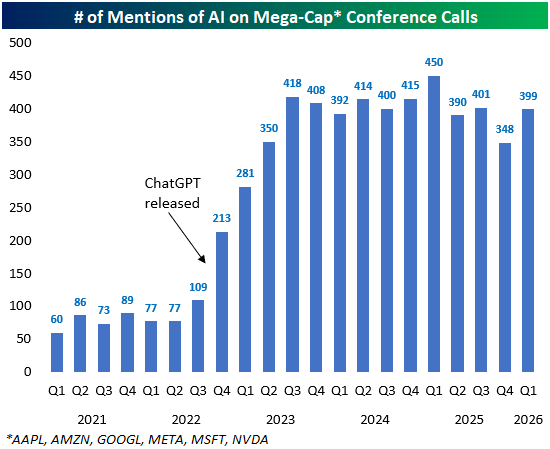
For the last few years, we’ve been monitoring “AI” mentions during earnings conference calls of the mega-caps, and now that NVIDIA’s (NVDA) earnings report is in the rearview, we can update our data for Q1 earnings season.
As shown below, “AI” was mentioned 399 times by management on the conference calls of AAPL, AMZN, GOOGL, META, MSFT, and NVDA this quarter.
That’s a bounce back from the 348 “AI” mentions last quarter, which was the lowest since Q1 2023.
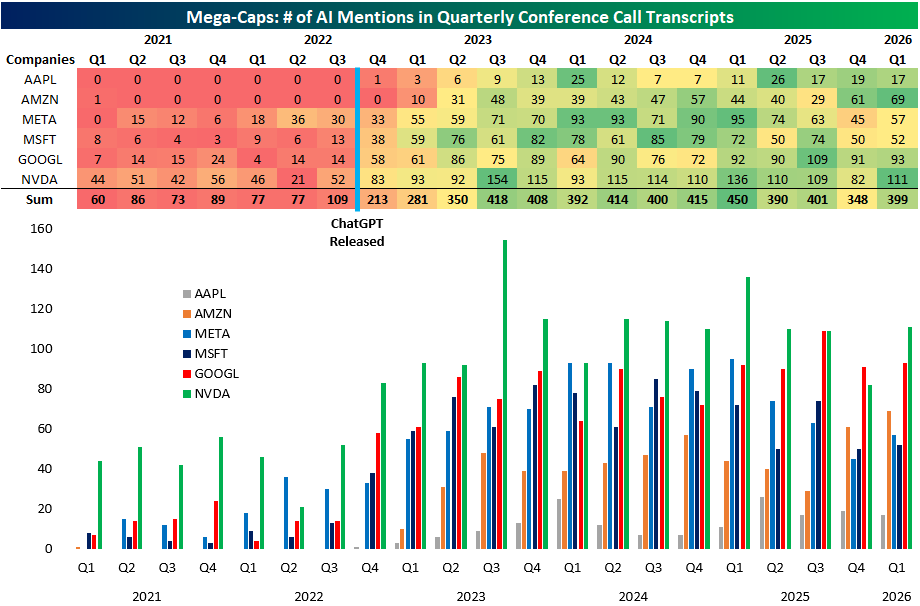
Below is a breakdown of “AI” mentions by stock, dating back to 2021. Five of the six saw increases in “AI” mentions this quarter, with Apple (AAPL) the lone mega-cap that mentioned it less. NVDA mentioned “AI” the most (111) and also saw the biggest quarter-over-quarter increase.
After a big drop off in “AI” mentions last quarter, Meta (META) saw a big jump as well, although they talked about “AI” a lot more back in 2024 and early 2025.
Want more from Bespoke? You can start by joining our Think BIG mailing list where you’ll receive an interesting market stat in your inbox a few times per week. All we need is your email address. Join now by clicking here or on the image below.
Chart of the Day – Streaky
Bespoke’s Morning Lineup – 5/26/26 – Deal or No Deal
See what’s driving market performance around the world in today’s Morning Lineup. Bespoke’s Morning Lineup is the best way to start your trading day. Read it now by starting a two-week trial to Bespoke Premium. CLICK HERE to learn more and start your trial.
“You’re short on ears and long on mouth.” – John Wayne

Below is a snippet of commentary from today’s Morning Lineup. Start a two-week trial to Bespoke Premium to view the full report.
The headlines over the weekend regarding the status of the war in Iran have been conflicting, but markets are taking the optimistic side. S&P 500 and Nasdaq futures were both firmly higher to kick off the holiday-shortened week. The S&P 500 is on pace to open at a new record high with a gain of 0.70%, while Nasdaq futures are up my more than 1%. European and Asian markets were mostly lower overnight, but that’s because they were open yesterday and saw broad gains.
Outside of equities, the 10-year yield is down 9 basis points and back below 4.5%, while crude oil is down 4% to $92.66, although it was down more over the weekend.
Here in the US today, we’re largely done with earnings season, but on the economic calendar, we’ll get house price data at 9 AM easter, Consumer Confidence at 10 AM, and the Dallas Fed Manufacturing Index at 10:30.
After the long weekend, we wanted to provide a quick recap of market performance heading into the holiday. The S&P 500 was up less than 1% for the week, but breadth was positive as three sectors rallied more than 3%, and another three rallied more than 1%. The only sectors that traded lower were Communication Services and Materials, which were both down less than 1%.
In terms of where sectors are trading compared to their trading ranges, four finished the week at overbought levels, while every other sector was neutral. Utilities and Materials are also the only sectors that headed into the weekend below their 50-day moving averages, but Utilities at least moved out of extreme oversold territory.
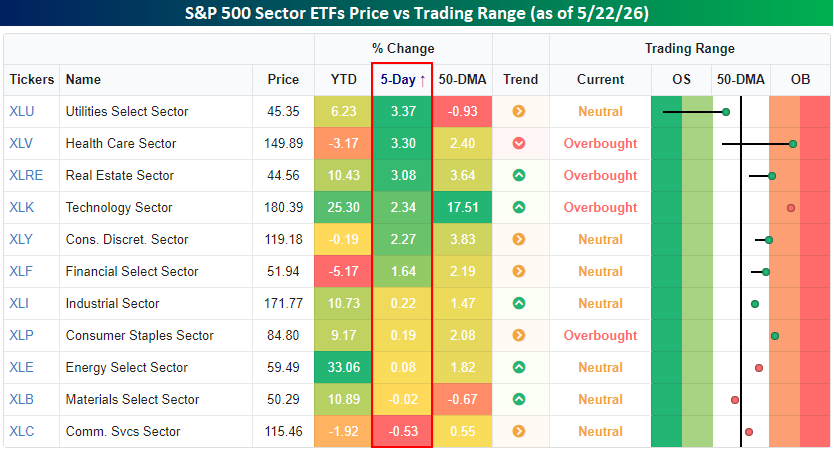
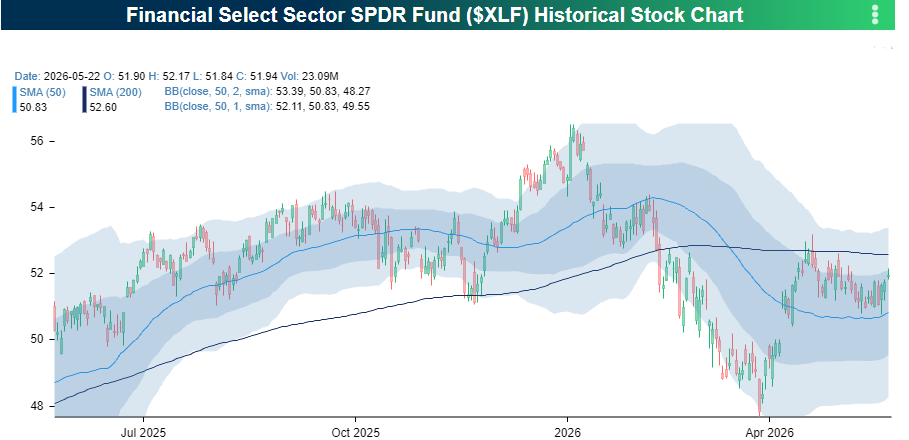
On a YTD basis, Financials has been the worst-performing sector with a decline of just over 5%. As shown in the chart below, the sector ETF finished the week right between its 50 and 200-DMAs. The 50-DMA, which has recently been acting as support, also coincides with longer-term support in the low 50s.
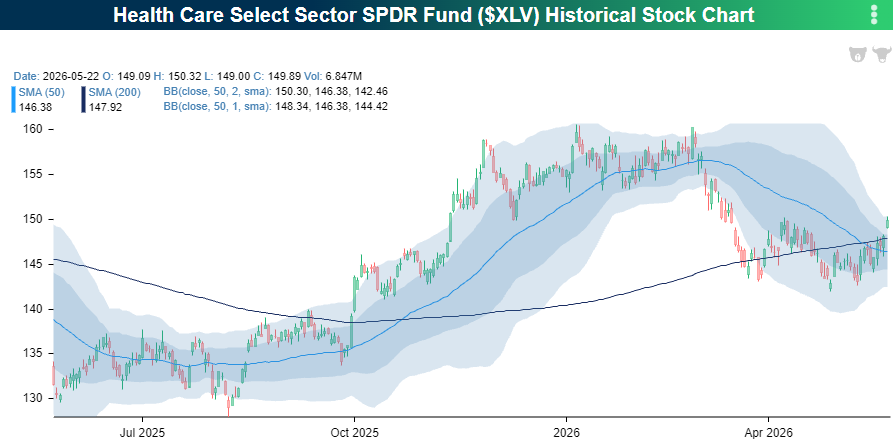
Health Care has been another laggard this year, but has recently shown some signs of life. After holding support in the low $140 range for the last few weeks, the sector broke out of a short-term trading range to close out the week and closed above both its 50 and 200-DMA for the first time in several weeks. Health Care has been out of favor for a long time now, but there’s a lot of runway for the sector between current levels and the high from earlier this year.
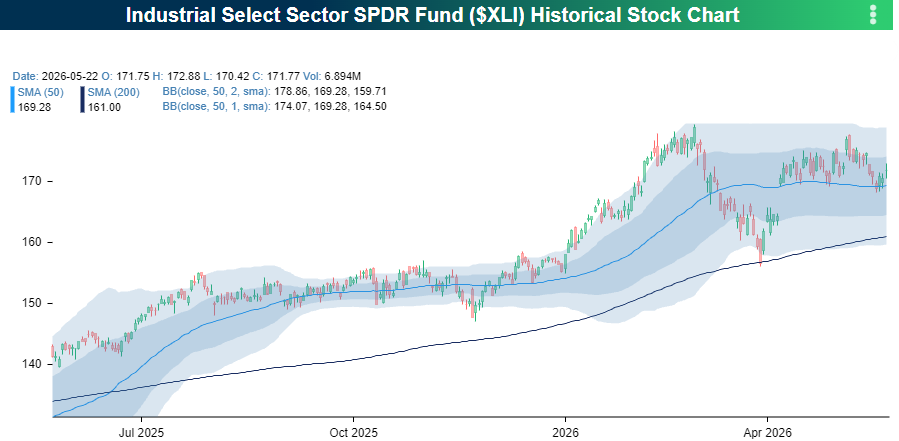
Finally, Industrials were a laggard last week, and along with other sectors, still have yet to trade to a new high. As shown in the chart below, though, the sector is getting close. XLI has traded in a sideways range for more than a month now, with downside support at the 50-DMA and upside resistance at the highs from earlier in the year. If the headlines are right and the Iran war is close to an end, the resistance may start to weaken.
Start a two-week trial to Bespoke Premium to continue reading today’s full Morning Lineup.
Bespoke Brunch Reads – 5/25/26
Welcome to Bespoke Brunch Reads — a linkfest of some of our favorite articles over the past week. The links are mostly market-related, but there are some other interesting subjects covered as well. We hope you enjoy the food for thought as a supplement to the research we provide you during the week.
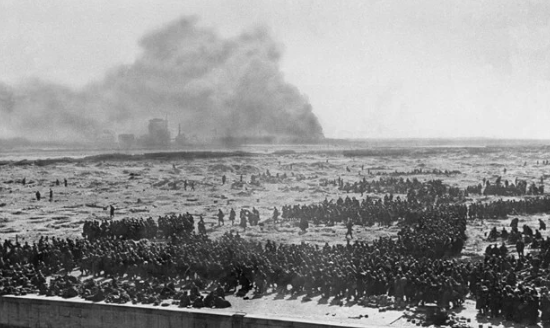
The Dunkirk Evacuation: By May of 1940, Nazi Germany had launched their invasion of Western Europe. The pure speed and efficiency of it shocked Allied commanders as it sent roughly 400,000 British, French, and Belgian troops to Dunkirk, a city on the coast of the English Channel.
On May 24th, Hitler issued his infamous “Halt Order,” stopping the advancement of his divisions just miles away from Dunkirk. To this day, this decision remains one of the most debated ones in military history as many historians argue it was a catastrophic blunder, while others believe it was a calculated tactical or political decision.
British Vice Admiral Bertram Ramsay coordinated an evacuation from Dover Castle, codenamed Operation Dynamo. The Dunkirk harbor was heavily damaged and could not accommodate large naval vessels. This forced the solution to come from hundreds of civilian boats, fishing vessels, and ferries. The soldiers waded into open water and were picked up and taken to large ships offshore. These became known as the “Little Ships of Dunkirk,” one of the most iconic symbols of the entire operation.
The evacuation ran from May 26th through June 4th. Those nine days changed the course of the war. Approximately 338,000 troops were successfully evacuated, far exceeding the initial estimate of 45,000. Winston Churchill warned the British public not to mistake Dunkirk for a victory, as “wars are not won by evacuations.” Roughly 40,000 troops, most being French soldiers, were left behind and captured. Large amounts of equipment were also abandoned, including tanks, artillery, vehicles, and supplies that Britain could barely afford to lose.
However, Dunkirk preserved the core of the British Army, allowing Britain to continue their fight in a time when most of Europe had already fallen. Without the evacuation, Britain may have been forced into a negotiated peace treaty with Germany, swinging the outcome of World War II. Christopher Nolan’s 2017 film brought the story to a new generation, depicting the event from the beach, the sea, and the air.
Education
Harvard Votes to Cap A’s in Effort to Curb Grade Inflation (WSJ)
Harvard is trying to crack down on grade inflation after A’s became so common that 55 students tied for the school’s top GPA award last year. The new policy would cap A grades in most classes, though students argue it could make courses more competitive and discourage people from taking harder or unfamiliar subjects. [Link]
Continue reading our weekly Brunch Reads linkfest by logging in if you’re already a member or signing up for a trial to one of our two membership levels shown below! You can cancel at any time.

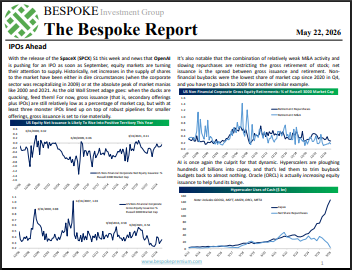
The Bespoke Report – 5/22/26 – IPOs Ahead
To read our weekly Bespoke Report newsletter and access everything else Bespoke’s research platform offers, start a two-week trial to Bespoke Premium. In this week’s report we look at the looming US equity supply. In addition to reduced buybacks driven by the AI capex boom, three mega IPOs are likely to price this year including SpaceX (SPCX). We review their S-1 as well as some implications for index investing. The AI trade is alive and well, and we look at how it’s impacting foreign markets, US earnings, and breadth in the domestic equity market. We also discuss commodities, interest rates, and notable US economic data released this week. Give it a read!

Daily Sector Snapshot — 5/22/26
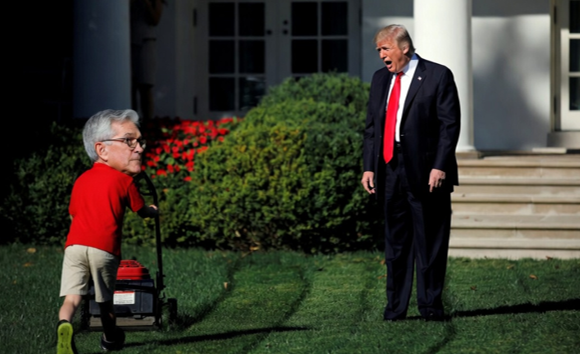
Good Riddance?
Based on his public comments towards now-former Fed Chair Jerome Powell, no one will be happier to see new leadership at the Federal Reserve than President Trump.
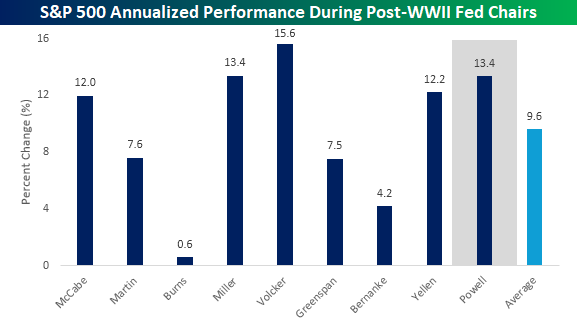
The chart below shows the S&P 500’s performance during Powell’s tenure, which has been much better than the President’s rhetoric towards the former Fed chair would suggest. During this period, the S&P 500 has more than doubled from under 3,000 to over 7,000. While the point-to-point gains have been strong, it’s been a pretty volatile ride.
The lower chart shows the S&P 500’s drawdowns from all-time highs throughout Powell’s tenure. During that time, the S&P 500 experienced two bear markets and two near-bear markets in which the S&P 500 declined close to 20%. In most cases, though, the declines were short-lived, and outside the 2022 bear market, after each prior bear or near-bear, the S&P 500 was back at new highs within weeks or months.
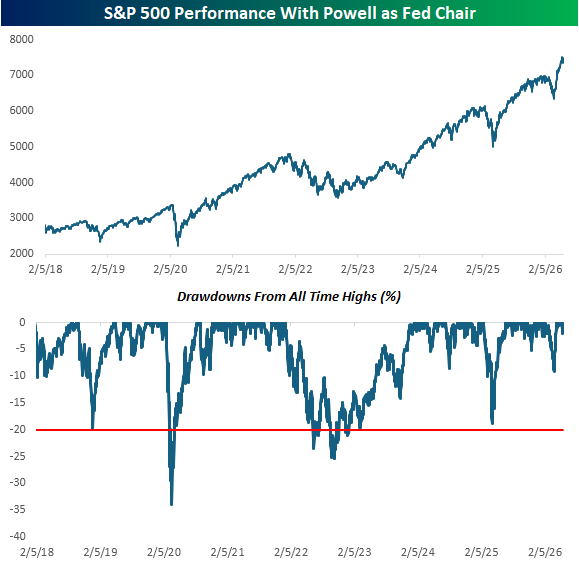
Through Friday morning, right up to the swearing-in ceremony, the S&P 500’s annualized gain during Powell’s tenure was 13.4%. Relative to Powell’s peers, the only Fed Chair since WWII who presided over a stronger stock market was Paul Volcker. Powell’s performance is tied with William Miller, who preceded Volcker, but he was chairman for less than two years, or less than a quarter of the time Powell had the same role.
President Trump is almost certainly thinking good riddance today, but from a strictly stock market perspective, it doesn’t get much better, or as the President or new Fed Chair would probably say, “at least not yet.”
Like this analysis? Join our premium members by starting a trial today! Click below for details on how to sign up:
