The Closer – Managed Care Pain, Dollar Drop, Homes – 1/27/26
Log-in here if you’re a member with access to the Closer.
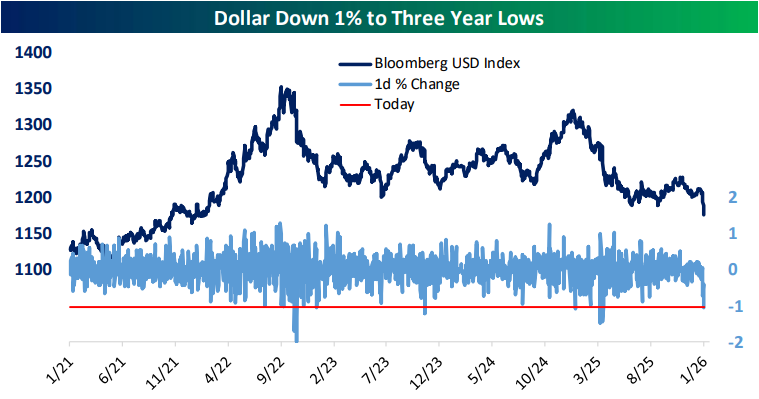
Looking for deeper insight into markets? In tonight’s Closer sent to Bespoke Institutional clients, we begin with a recap of some of the latest earnings and the pain in managed care stocks (page 1). We then review the new low and bad day for the dollar (page 2) including a look at performance when it hits a 52-week long alongside a 52-week high in US equities (page 3). We then round out tonight’s note with an update on Case-Shiller home prices, consumer confidence, and regional Fed manufacturing gauges (page 4).
See today’s full post-market Closer and everything else Bespoke publishes by starting a 14-day trial to Bespoke Institutional today!
Daily Sector Snapshot — 1/27/26
Q4 2025 Earnings Conference Call Recaps: Polaris (PII)
Bespoke’s Conference Call Recaps use AI to summarize lengthy earnings calls. The commentary below is AI-generated and then edited by Bespoke for quality control. As always, none of these summaries should be construed as recommendations to buy or sell any securities, and investors should do their own research and/or consult with a financial professional before making any investment decisions.
Our latest recap available to Bespoke subscribers covers Polaris’ (PII) Q4 2025 earnings call.
![]()
Polaris (PII) is a North American powersports manufacturer, producing off-road vehicles (ORVs like side-by-sides and ATVs under brands including RZR, Ranger, and XPEDITION), snowmobiles, motorcycles, three-wheelers (Slingshot), and marine products (pontoon boats under Bennington, Godfrey, and Hurricane). With approximately 2,000 dealers across North America, Polaris serves both recreational consumers and commercial customers in agriculture, ranching, and construction. PII had an exceptionally challenging 2025, facing $215 million in tariff headwinds, its largest obstacle since the pandemic, yet still gained market share across all segments. The company reduced China-sourced materials from 18% to 14% of COGS, targeting below 5% by 2027. However, consumer demand remains bifurcated. Utility segments show strength driven by commercial buyers benefiting from tax incentives, while recreational purchases stall due to elevated interest rates and macro uncertainty. The pending Indian Motorcycle separation, closing Q1 2026, will add $0.75-$0.80 to EPS. For 2026, Polaris guides to 1-3% sales growth (7-9% organic ex-Indian) despite $90 million in incremental tariffs. PII beat EPS and revenue estimates, though cut guidance and shares fell as much as 8.6% on 1/27…
Continue reading our Conference Call Recap for PII by becoming a Bespoke Institutional subscriber. You can sign up for Bespoke Institutional now and receive a 14-day trial to read our newest Conference Call Recap. To sign up, choose either the monthly or annual checkout link below:
Q4 2025 Earnings Conference Call Recaps: NextEra Energy (NEE)
Bespoke’s Conference Call Recaps use AI to summarize lengthy earnings calls. The commentary below is AI-generated and then edited by Bespoke for quality control. As always, none of these summaries should be construed as recommendations to buy or sell any securities, and investors should do their own research and/or consult with a financial professional before making any investment decisions.
Our latest recap available to Bespoke subscribers covers NextEra Energy’s (NEE) Q4 2025 earnings call.
![]()
NextEra Energy (NEE) is America’s largest electric utility company by market cap, operating Florida Power & Light (FPL), which serves over 12 million people across Florida, and NextEra Energy Resources, the world’s largest generator of renewable energy from wind and solar. The company has built more renewables, battery storage, and gas-fired generation than any competitor over the past two decades. NextEra provides insight into the intersection of data center power demand, grid modernization, and the economics of serving hyperscale loads while maintaining residential affordability. NextEra delivered $3.71 adjusted EPS (up 8% YoY) and guided to 8%+ annual growth through 2035. The call centered on explosive AI-driven power demand. Management disclosed 20 GW of data center interest in Florida (9 GW in advanced discussions) and a 30 GW nationwide backlog. The company is pioneering a “bring your own generation” (BYOG) model where hyperscalers fund infrastructure buildout, addressing the affordability crisis spotlighted by the White House’s January PJM framework. NextEra secured solar/battery supply through 2029 and 4 GW of gas turbine capacity with GE Vernova, while pursuing nuclear restarts and 1.7 GW of recontracting opportunities. Florida’s new 4-year rate agreement enables $90-100B in infrastructure investment while keeping bills 30% below the national average. Despite missing revenue estimates, NEE beat on EPS and the stock was up as much as 3.7% on 1/27…
Continue reading our Conference Call Recap for NEE by becoming a Bespoke Institutional subscriber. You can sign up for Bespoke Institutional now and receive a 14-day trial to read our newest Conference Call Recap. To sign up, choose either the monthly or annual checkout link below:
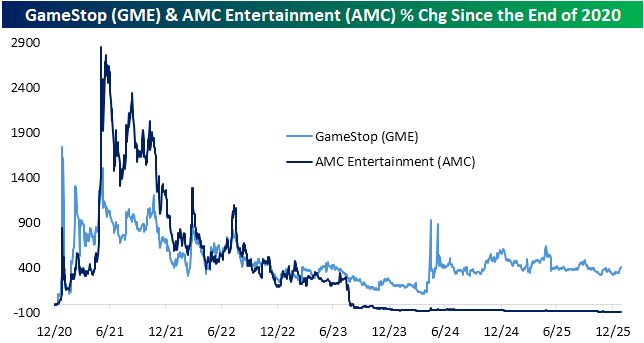
Five Years Since Meme-Stock Mania
It has now been five years since the height of meme-stock mania. In January 2021, there was a surge in buying of crypto and NFTs, but perhaps the most in-vogue assets at the time were extremely high short interest names like GameStop (GME) and AMC Entertainment (AMC). These two stocks experienced enormous short squeezes led by the Reddit message board r/wallstreetbets. Remember Roaring Kitty?
Before the first month of 2021 ended, both GME and AMC were ten baggers.
As shown below, the years since haven’t seen these stocks hold onto gains. GameStop (GME) is still firmly in the green since the end of 2020 (with a gain of more than 400%), but it’s well off its peak from January 2021. Meanwhile, AMC is down 99% from its all-time highs and closely 90% since the end of 2020.
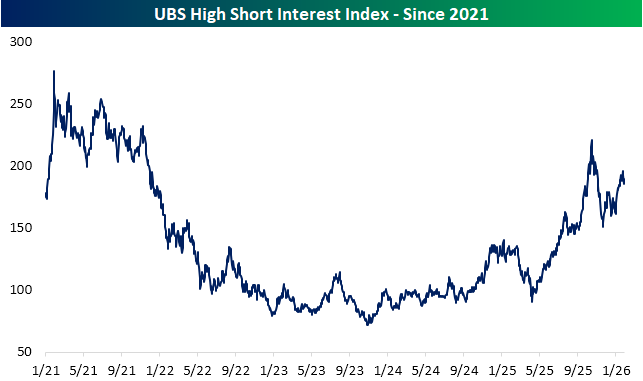
The index below from UBS tracks the 100 most highly shorted stocks with market caps above $1 billion and includes a monthly rebalancing. After shooting higher in January 2021, these stocks fell hard in the back half of 2021 and then plunged during the bear market of 2022. With that said, the index bottomed in late 2023 and has been on its way upwards ever since.
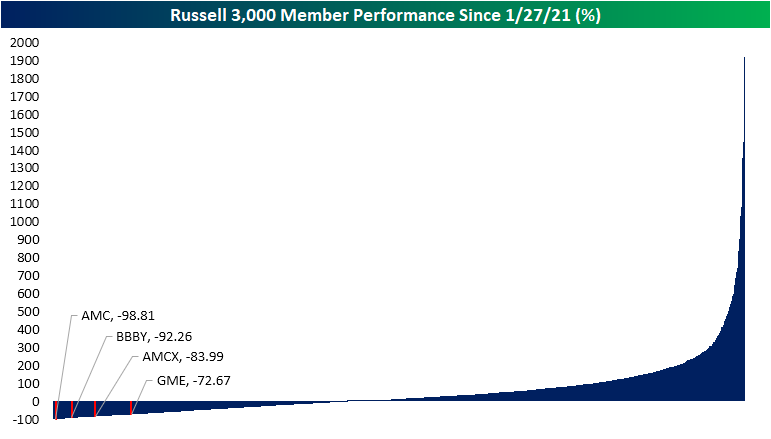
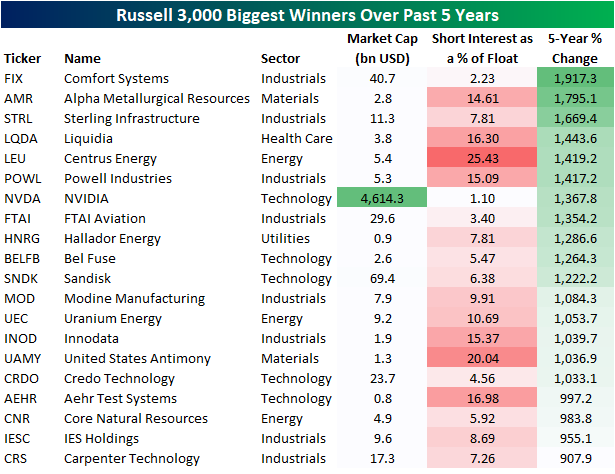
In the chart below, we show the individual performance of Russell 3,000 stocks since the peak of meme-stock mania on 1/27/21. Some of the most notorious meme stocks in early 2021 like AMC, BBBY, and GME are among the index’s worst performers since then. While opportunities for short squeezes may always be present, sometimes heavily shorted names are being bet against for good reason.
So which stocks have been the biggest winners in the five years since the peak of meme-stock mania? As you might expect, the emergence of AI means that among the biggest winners are AI headliners such as NVIDIA (NVDA), Comfort Systems (FIX), and Sandisk (SNDK); all up more than 1,000%.
Not a Bespoke client? We’d love for you to give our equity research platform, Bespoke Premium, a try. You can sign up for complimentary access for 14 days at this link to read our full 2026 Investor Sentiment report and start receiving our daily research emails today!

Home Prices vs. Stocks Long Term
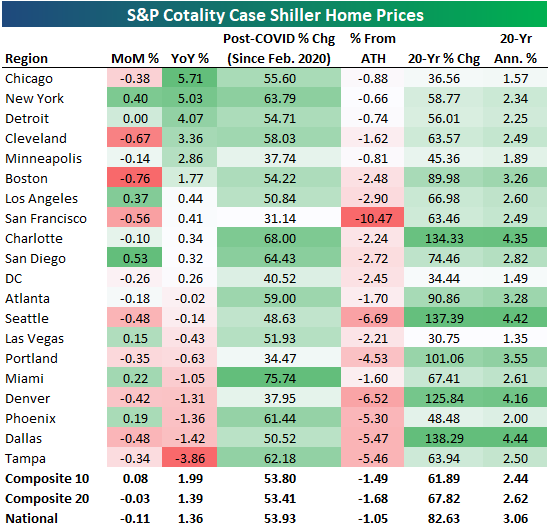
The latest Case Shiller home price data from S&P Cotality was published today and showed a small month-over-month decline of 0.11% at the national level. Home prices were up just 1.36% year-over-year nationally as well.
Across the twenty cities tracked, 13 saw small month-over-month declines, with Boston down the most at -0.76%. Of the six cities that were up on the month, San Diego (+0.53%) and New York (+0.40%) were up the most.
Six cities saw year-over-year gains of more than 1%, and they’re all in either the northeast or midwest: Chicago (+5.7%), New York (+5%), Detroit (+4.1%), Cleveland (+3.4%), Minneapolis (+2.9%), and Boston (+1.8%).
On the flip side, the five cities that are down over the last year are mostly in the Sunbelt: Miami (-1.1%), Denver (-1.3%), Phoenix (-1.4%), Dallas (-1.4%), and Tampa (-3.9%).
Below we show month-over-month and year-over-year home price changes from today’s data, along with a few additional stats like post-COVID change, % from all-time highs, and 20-year change.
Miami is up the most since COVID (February 2020) with a gain of 75.7%, while San Francisco is up the least at 31.1%. San Francisco is also down the most from all-time highs at -10.5%.
Unfortunately, not one city tracked made a new high in the latest data.
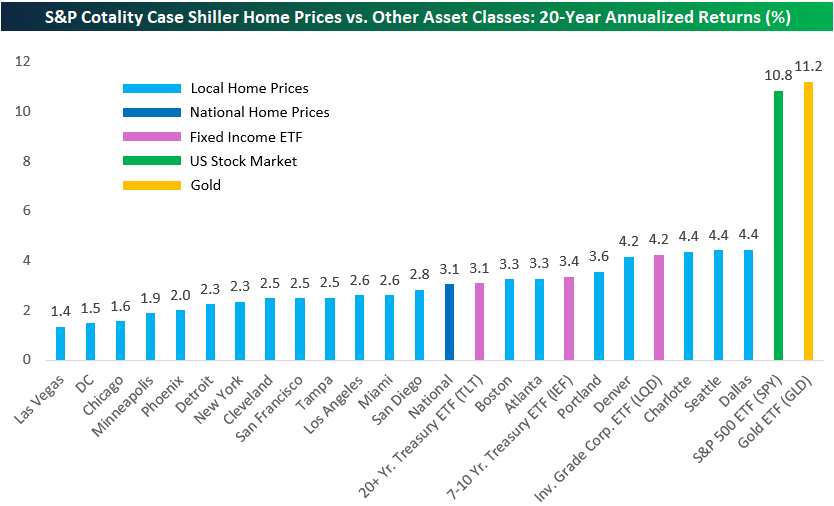
While it may seem like home prices have skyrocketed around the country, 20-year returns are actually pretty small and nowhere close to matching the returns of equities (or gold).
As shown below, most cities tracked have seen annualized home price gains of less than 3% over the last twenty years. That’s worse than the 3.1% annualized return for the long-term Treasury ETF (TLT).
Only three of the twenty cities have seen home prices gain more than the investment-grade corporate bond ETF (LQD): Dallas, Seattle, and Charlotte (4.4% annualized).
Compared to the S&P 500’s 10.8% annualized gains over the last twenty years and gold at 11.2%, home-price gains look puny.
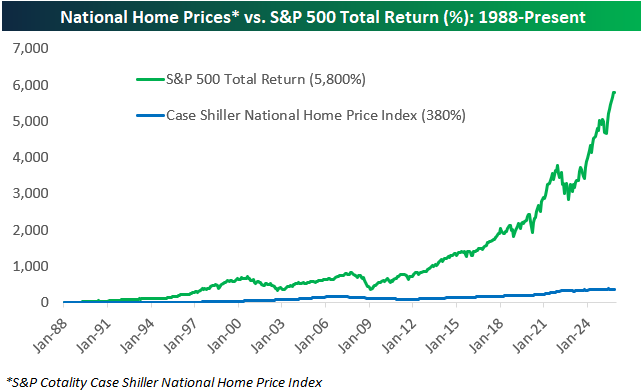
The National home price index tracked by Case Shiller goes back to the late 1980s, and as shown below, it’s up 380% since 1988 versus a total return of nearly 6,000% for the S&P 500.
While there are good reasons for homeownership that include the potential for price appreciation, it’s important to understand that excess capital has historically been better off put elsewhere.
Not a Bespoke client? We’d love for you to give our equity research platform, Bespoke Premium, a try. You can sign up for complimentary access for 14 days at this link to read our full 2026 Investor Sentiment report and start receiving our daily research emails today!
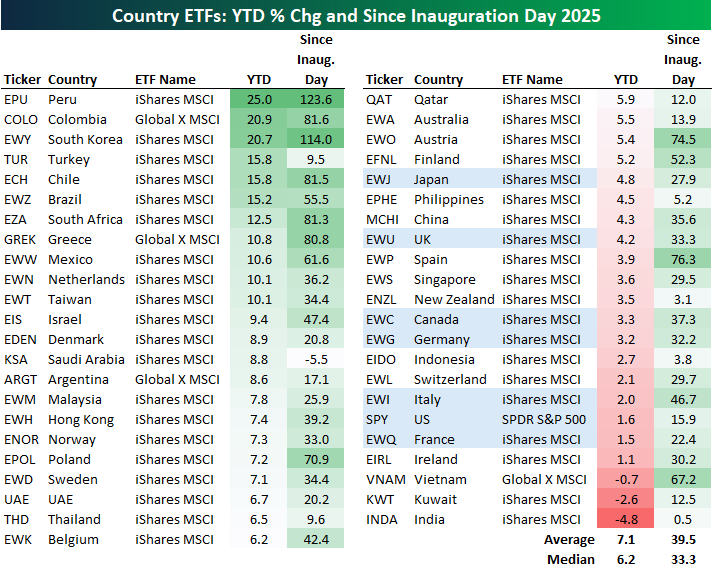
Country ETFs Crushing It
As domestic equities have struggled to hang onto gains so far this year, most country ETFs are already sitting on solid year-to-date returns.
Below is a snapshot of more than forty country ETFs traded on US exchanges. The average year-to-date change of all these country ETFs is already above 7%, while eleven are already up 10%+ and three are up 20%+. Peru (EPU) is up the most at +25%, followed by Colombia (COLO) and South Korea (EWY) at just over 20%.
Note that all seven G7 country ETFs (highlighted in light blue) are up less than the overall YTD average, with Japan (EWJ) up the most of this small group at +4.8%. The US (SPY) ranks 2nd to last of the G7 with its 1.6% YTD gain in front of only France (EWQ) at 1.5%.
Three country ETFs are in the red so far this year: Vietnam (VNAM), Kuwait (KWT), and India (INDA).
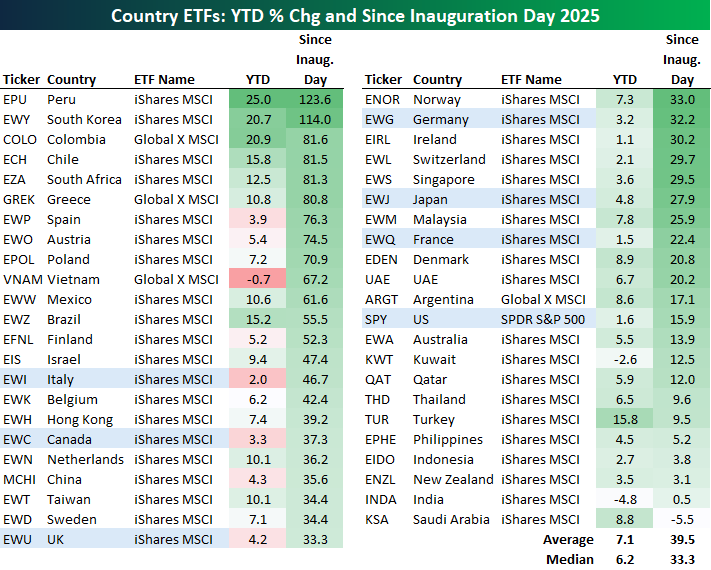
Along with strong outperformance versus US equities so far this year, country ETFs have outdone the US since Inauguration Day a little over a year ago as well. The 40+ country ETFs shown are up an average of 39.5% since President Trump’s 2nd term officially began last January, with Peru (EPU) and South Korea (EWY) leading the way with gains of 110%+. Colombia (COLO), Chile (ECH), South Africa (EZA), and Greece (GREK) rank 3rd through 6th with gains of just over 80%, while Spain (EWP), Austria (EWO), Poland (EPOL), and Vietnam (VNAM) round out the top ten.
Italy (EWI) has been the best performing G7 country since Inauguration Day 2025 with a gain of 46.7%, followed by Canada (EWC) at +37.3%. The US (SPY) has been the weakest G7 country over this time frame with a gain of just 15.9%.
Saudi Arabia (KSA) is the only country ETF that has seen a share-price decline (-5.5%) since Trump’s 2nd term began, while India (INDA) has done the second worst of the entire group with a gain of just 0.5%.
Not a Bespoke client? We’d love for you to give our equity research platform, Bespoke Premium, a try. You can sign up for complimentary access for 14 days at this link to read our full 2026 Investor Sentiment report and start receiving our daily research emails today!
B.I.G. Tips – Fed Day: Put on Hold
Chart of the Day: Rocks Beat Stocks
Bespoke’s Morning Lineup – 1/27/26 – Sick Health Care Stocks
See what’s driving market performance around the world in today’s Morning Lineup. Bespoke’s Morning Lineup is the best way to start your trading day. Read it now by starting a two-week trial to Bespoke Premium. CLICK HERE to learn more and start your trial.
“We’re all mad here.” – Lewis Carroll, Alice in Wonderland

Below is a snippet of commentary from today’s Morning Lineup. Start a two-week trial to Bespoke Premium to view the full report.
Stocks are poised to build on yesterday’s rally with S&P 500 futures up 0.25% while the Nasdaq gains 0.60%. Treasury yields are slightly higher as the 10-year yield sits just under 4.23% while the dollar is weaker. Crude oil is little changed at $60 per barrel, while natural gas is giving back some of the massive gains of last week with a drop of over 6%. Precious metals are also lower after their surges to start the week, and Bitcoin is slightly higher.
On the data front, we’ll get Case Shiller numbers at 9 AM, and then the Richmond Fed and Consumer Confidence at 10 AM. After those reports, all eyes will shift to tomorrow’s FOMC announcement, although there’s already widespread agreement that rates will be left unchanged, and the upcoming mega cap earnings.
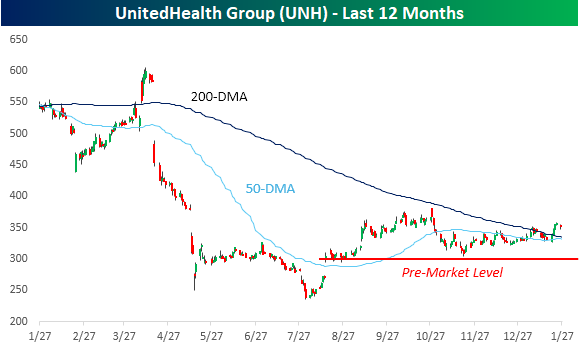
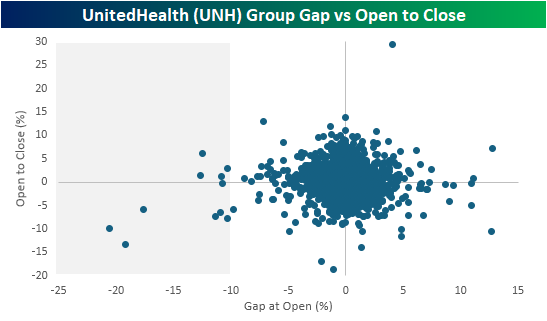
Following last night’s announcement that the U.S. government proposed a much lower-than-expected payment increase of just 0.09% for Medicare Advantage plans in 2027, coupled with a tepid revenue outlook for the year ahead, shares of UnitedHealth Group (UNH) and many of its peer stocks are down sharply in pre-market trading. For just UNH alone, its impact on the Dow Jones Industrials will be a decline of 350 points, so without that, the Dow would be higher.
Looking at a one-year chart of UNH shows that, based on where the stock is trading in the pre-market, it is on track to test support at the low end of its current six-month range, and a break of that level would put the lows from the summer back into play.
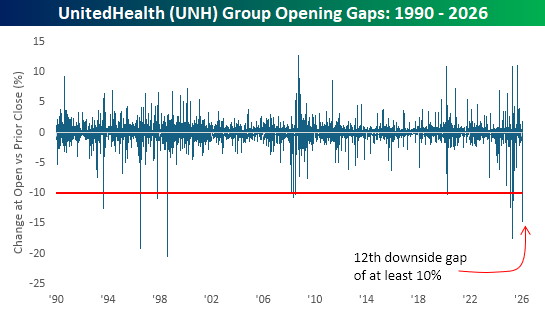
Going back to 1990, today’s downside gap will be the 12th time that UNH has gapped down more than 10%, and the frequency of those downside moves has really increased in pace over the last year. From late 2008 through the end of 2024, there was only one occurrence (during Covid on 3/16/20), but today’s decline will be the fifth in the last year alone!
The scatter chart below compares UNH’s daily opening gaps with its intraday performance from the open to close. The shaded area highlights each time the stock gapped down more than 10%, and following most of those opening declines, dip buyers weren’t quick to step in during the trading day, and in many cases, the stock added significantly to those opening declines.
Trivia Time. We wanted to close today with a little bit of trivia, and this one comes partially from Yahoo! Sports. If Drake Maye wins the Super Bowl this year, the University of North Carolina would be just the sixth school to produce a U.S. president and a Super Bowl-winning QB. What were the other five?
And as a bonus question, 36 different head coaches have won a Super Bowl title. What college/university has produced the most winning head coaches? Check back tomorrow for an answer, or feel free to respond with your guess. No cheating!