Chart of the Day – Staples in the Spotlight
B.I.G. Tip – Software: The Good, the Bad, and the Ugly
Bespoke’s Morning Lineup – 2/4/26 – AI Spreads its Tentacles
See what’s driving market performance around the world in today’s Morning Lineup. Bespoke’s Morning Lineup is the best way to start your trading day. Read it now by starting a two-week trial to Bespoke Premium. CLICK HERE to learn more and start your trial.
“Wherever you come near the human race there’s layers and layers of nonsense.” – Thornton Wilder, Our Town

Below is a snippet of commentary from today’s Morning Lineup. Start a two-week trial to Bespoke Premium to view the full report.
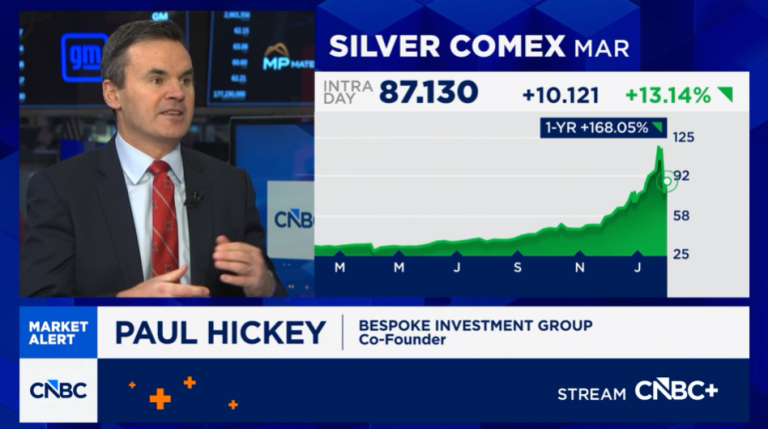
Paul Hickey appeared on CNBC’s Squawk on the Street yesterday to discuss markets and precious metals. To view part of the segment, click on the image below.
Futures are modestly higher after investors look to pick up the pieces of yesterday’s rout in certain areas of the market. The S&P 500 is indicated to open 0.20% higher, while the Nasdaq is basically unchanged. AMD is the big loser this morning with a decline of 9% after the company reported better-than-expected earnings but raised sales guidance by less than some analysts had expected.
Outside of equities, treasury yields are little changed, and energy-related commodities are fractionally higher. Precious metals have been livelier in the early going as gold rallies back above $5,000, and silver pushes towards $90 with a gain of nearly 8%. The strength in those assets is once again not translating to the crypto space as Bitcoin is flat, and other secondary coins trade lower.
On the economic calendar today, we got ADP at 8:15, which showed positive job creation but at half the pace economists had expected (22K vs 45K). The ISM Services report hits the tape at 10 AM, and following Monday’s big surge in the manufacturing sector, the market will be looking to see how broad the rebound is. There’s another busy batch of earnings after the close, but Alphabet’s (GOOGL) report will likely have the largest market impact.
Despite the weakness in the US yesterday, Asian stocks mostly rallied overnight. The Nikkei was down 0.8%, but South Korea rallied more than 1.5% as PMI data for the Services sector topped expectations. In Europe, the STOXX 600 is also up over half a percent, and Germany is the only major benchmark trading lower. Unlike in Asia, where most PMIs for the services sector were better than expected, most European readings, except for France and Italy, were weaker than expected.
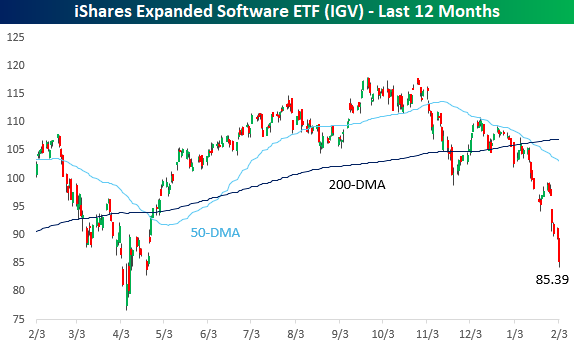
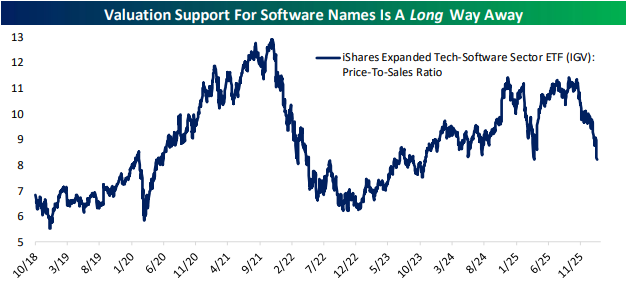
Yesterday was a rough day for the markets and especially technology, and with a decline of over 2%, it was easily the worst-performing sector on the day. Software stocks were especially hit hard as the iShares Expanded Software ETF (IGV) fell more than 4.5%, taking it down to levels not seen since the tariff-tantrum last April. Year-to-date, the ETF has already declined over 19%.
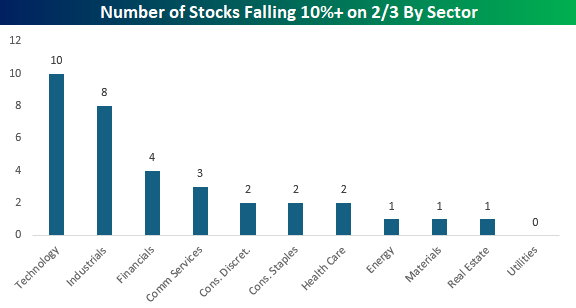
While tech stocks faced the brunt of the weakness, it was surprising to see that there weren’t more companies from the Technology sector on the list of worst performers yesterday. In the S&P 1500, 34 stocks fell more than 10%, and of those, 10 were from the Technology sector. Don’t get us wrong, ten is still a lot out of a universe of 34, but for a sell-off where attention was so focused on tech, other sectors weren’t immune. In the Industrials sector, you had stocks like Equifax (EFX), Transunion (TRU), and LegalZoom (LZ) all fall by double-digit percentages, while the Financials sector saw stocks like FactSet (FDS) and S&P Global (SPGI) experience major haircuts.
Remember, there are two sides to the growth of AI. In addition to the companies and sectors that will undoubtedly harness AI and benefit from it through increased productivity, there will also be those that have their entire business models upended and destroyed by AI. Apparently, it could happen faster than many investors think.
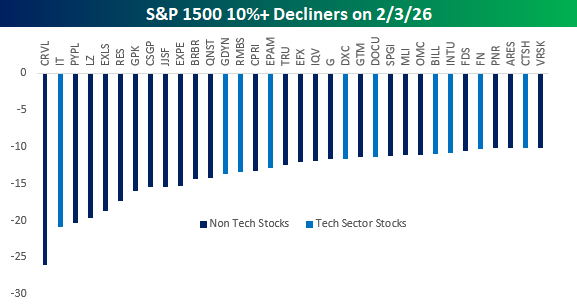
Finally, the chart below shows the sector breakdown of the 34 stocks that declined 10% or more yesterday. Tech obviously leads the list, but Industrials had eight stocks on the list, and Financials had four. In fact, the only sector not represented was Utilities.
The Closer – Software Slam, Walmart (WMT) Wows, Dividends – 2/3/26
Log-in here if you’re a member with access to the Closer.
Looking for deeper insight into markets? In tonight’s Closer sent to Bespoke Institutional clients, we start out with a look into the pain trade that is software (pages 1 – 3). We also check in on dividend stocks and the latest batch of earnings (pages 4 & 5). We then finish with a recap of the latest LMI reading (page 6) and the performance of supply chain stocks (page 7).
See today’s full post-market Closer and everything else Bespoke publishes by starting a 14-day trial to Bespoke Institutional today!
The Triple Play Report: 2/2/26
An earnings triple play is a stock that reports earnings and manages to 1) beat analyst EPS estimates, 2) beat analyst sales estimates, and 3) raise forward guidance. You can read more about “triple plays” at Investopedia.com where they’ve given Bespoke credit for popularizing the term. We like triple plays as an indication that a company’s business is firing on all cylinders, with better-than-expected results and an improving outlook. A triple play is indicative of positive “fundamental momentum” instead of pure fundamentals, and there are always plenty of names with both high and low valuations on our quarterly list.
Bespoke’s Triple Play Report highlights companies that have recently reported earnings triple plays, and it features commentary from management on triple-play conference calls, company descriptions and analysis, and price charts. Bespoke’s Triple Play Report is available at the Bespoke Institutional level only. You can sign up for Bespoke Institutional now and receive a 14-day trial to read today’s Triple Play Report. To sign up, choose either the monthly or annual checkout link below:
Bespoke Institutional – Monthly Payment Plan
Bespoke Institutional – Annual Payment Plan
Bespoke Investment Group, LLC believes all information contained in these reports to be accurate, but we do not guarantee its accuracy. None of the information in these reports or any opinions expressed constitutes a solicitation of the purchase or sale of any securities or commodities. This is not personalized advice. Investors should do their own research and/or work with an investment professional when making portfolio decisions. As always, past performance of any investment is not a guarantee of future results. Bespoke representatives or clients may have positions in securities discussed or mentioned in its published content.
Daily Sector Snapshot — 2/3/26
Chart of the Day – What Will You Do For Me Next?
Hardware Flies, Software Dies
Software stocks are getting slammed once again today as there appears to be no floor in the current thinking that AI will crush the software-as-a-service (SaaS) space.
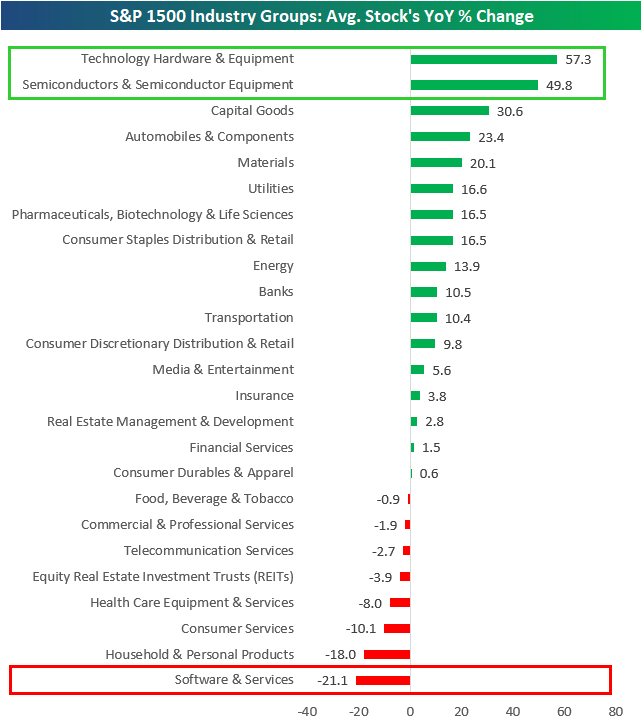
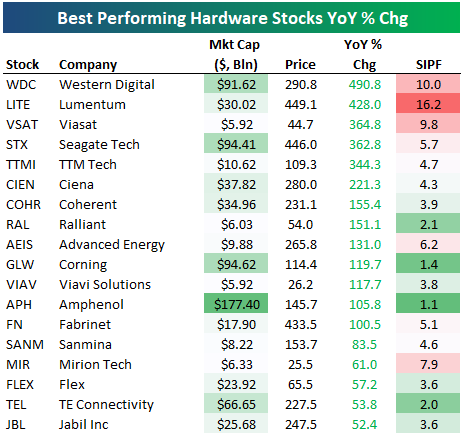
The dichotomy in Tech hardware versus Tech software over the last year has been amazing to watch. As shown below, the average Tech Hardware stock in the S&P 1500 is up 57.3% over the last year, while Semis are up roughly 50%. These two have easily been the best performing groups in the market since last February.
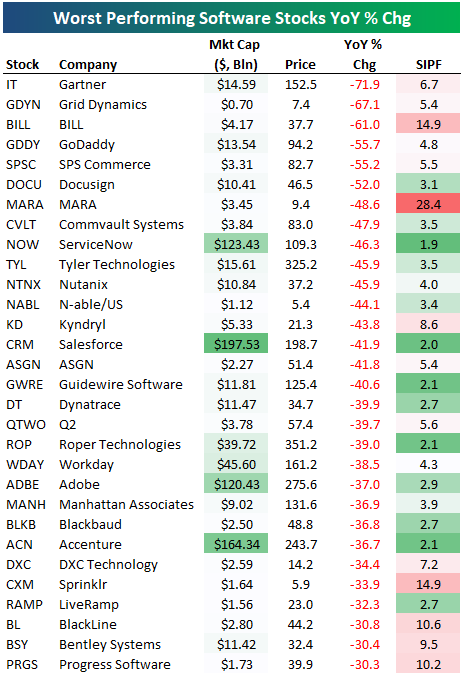
On the other side of the Tech sector sits the Software and Services group, where the average stock is down more than 20% over the last year. Software has now been the worst performing group in the market over this period.
Below is a table showing the best performing stocks in the Tech Hardware group over the last year, where all the names listed are up more than 50% YoY; 13 are up more than 100%.
Conversely, there are thirty stocks in the Software group down more than 30% over the last year, and six are down more than 50%.
It’s ugly out there in software land, and it’s starting to bleed over into the rest of the market as the Nasdaq 100 (QQQ) hasn’t been able to make a new high in over three months.

Walmart (WMT): The First Trillion Dollar Big Box
While digital-retail company (and many other things) Amazon (AMZN) crossed the $1+ trillion mark a few years ago, it took until today for its biggest “physical” competitor — Walmart (WMT) — to do the same.
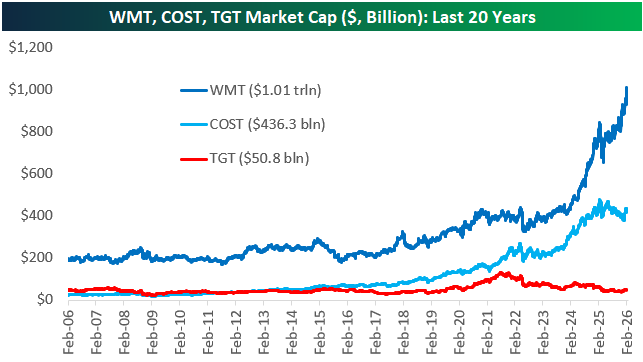
Walmart (WMT) has had an amazing run so far during the 2020s, with its market cap rising from a little more than $300 billion in early 2020 to more than $1 trillion today.
Costco (COST) has seen huge gains during the 2020s as well, while another major player in the big box retail space — Target (TGT) — has gone in the opposite direction lately.
Twenty years ago in early 2006, Walmart had a market cap of $189 billion versus $48.3 billion for Target.
Target’s current market cap of $50.8 billion is just $2.5 billion more than it was twenty years ago, while WMT’s market cap is up 433% to more than $1 trillion.
While WMT was just 3.9x bigger than TGT twenty years ago, it’s nearly 20x as big today.
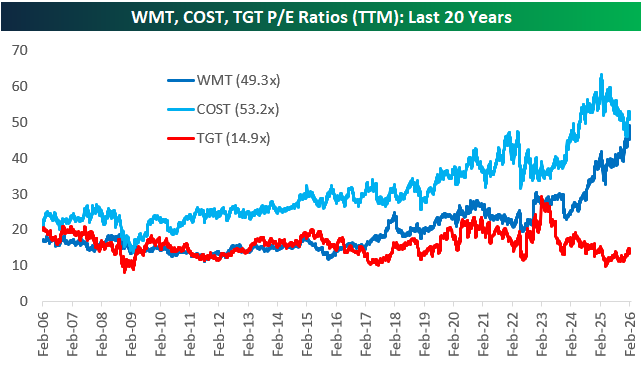
Walmart’s run has been accompanied by EPS and revenue growth, but share price has definitely risen a lot more, causing multiple expansion.
As a trillion dollar company, Walmart also now trades at 49.3 times its trailing 12-month EPS. That sounds more like a high-growth Tech stock multiple rather than a big-box Consumer Staples stock.
Target (TGT), in the meantime, has seen its P/E multiple fall down to just 14.9x, while COST’s P/E of 53.2x is even higher than WMT’s.
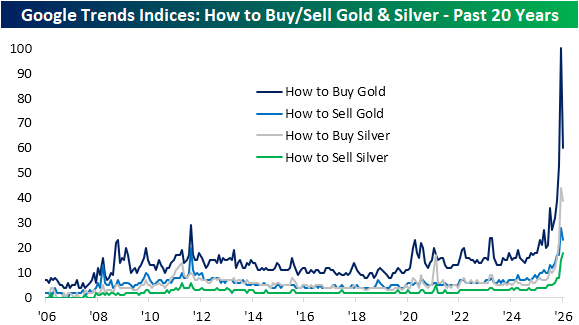
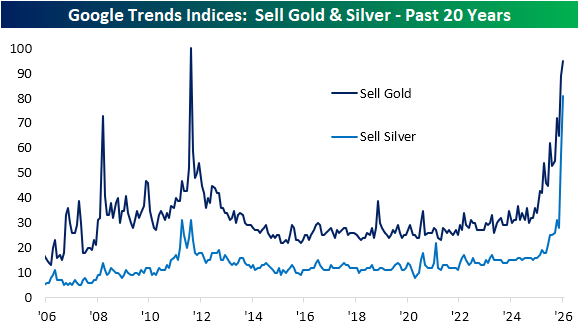
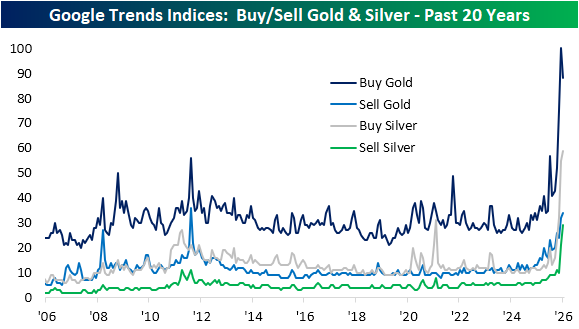
Precious Search Interest
Today has been another volatile session for gold and silver prices, with the former up over 7% as of this writing and the latter up well over 15% versus yesterday’s close.
The huge move higher (and lower) in precious metals has resulted in surging interest from consumers based on Google search interest.
Google Trends tracks and indexes search interest on Google’s search engine for a given word or phrase over a given time period. Readings of 100 indicate the peak for search interest, readings of 50 would be half of that peak, and so on.
As shown below, the latest surge in gold and silver prices has corresponded with a surge in search interest for both “sell gold” and “sell silver.”
For gold, search interest is approaching August 2011 records, whereas the reading for sell silver is now far and away at record highs. In other words, people have record or near record interest in selling their precious metals.
Amazingly, though, search interest for “buy gold” and “buy silver” has also surged to record highs that are at levels much higher than the “sell” version of the phrase. As prices have skyrocketed, more people seem to be interested in buying gold and silver than selling them.
We also like to look at “How to” searches. These can proxy first time buyers or sellers, or alternatively, more casual investor interest. Again, these indices are broadly elevated and hit new records by massive margins recently. As shown below, searches for “how to buy gold” have skyrocketed as gold prices have gone parabolic, while the “how to sell” versions have also jumped but not by nearly as much.