Chart of the Day: New Highs Expand, Led by Consumer Staples
Bespoke’s Morning Lineup – 2/9/26 – Hangover Day
See what’s driving market performance around the world in today’s Morning Lineup. Bespoke’s Morning Lineup is the best way to start your trading day. Read it now by starting a two-week trial to Bespoke Premium. CLICK HERE to learn more and start your trial.
“All the measures of the Government are directed to the purpose of making the rich richer and the poor poorer.” – William Henry Harrison

Below is a snippet of commentary from today’s Morning Lineup. Start a two-week trial to Bespoke Premium to view the full report.
Paul Hickey will be appearing on Investopedia’s Express Live today at 10:00 AM Eastern. You can view the segment on YouTube or LinkedIn.
Whether it’s staying up late watching the Super Bowl last night or too much excitement from Friday’s rally that took the DJIA above 50K for the first time, US equity futures are subdued to kick off the week. The S&P 500 is on pace for a decline of 0.15% at the open, while the Nasdaq is down twice as much. Down, but nothing major.
Outside of equities, yields are higher with the 10-year yield up 4 bps to just under 4.25%. Crude oil is modestly higher, erasing earlier losses, while gold has bounced back above $5K per ounce and silver rallies 4% to get back above $80 per ounce. Crypto had a respite from selling on Friday and moved back above $70,000, but the bounce hasn’t lasted long. This morning, we’re not only back below $70K but barely hanging onto $69K.
There’s not a lot on the data calendar today, but we will hear from a few Fed officials. More importantly, December Retail Sales will be released tomorrow, the January Non-Farm Payrolls report will hit the tapes on Wednesday, and then on Friday, we’ll get CPI for January.
Asian markets took the cue from Dow 50K on Friday and kept the rally going to kick off the week. The Nikkei surged almost 4%, while South Korea rallied just over 4%. Snap elections in Japan were positive for PM Takaichi, giving her party a supermajority, which should pave the way for her to implement her high-spending growth agenda.
In Europe, the tone isn’t quite as exuberant this morning, but stocks are broadly higher. The STOXX 600 is up 0.3%, and the UK is the only major benchmark facing losses. The February Investor Confidence survey from Sentix came in higher than expected as it unexpectedly moved into positive territory.
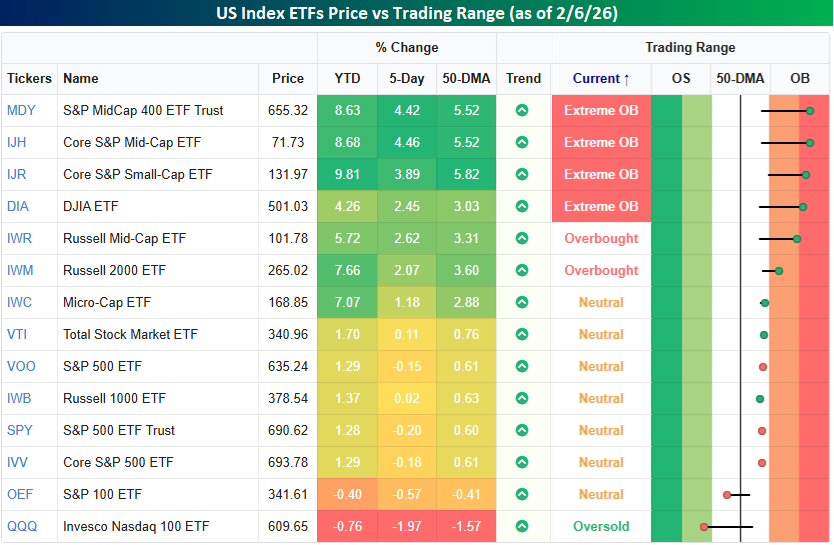
The diverging performance of small and large-cap stocks continued last week. The most overbought US index ETFs to close out the week are all generally smaller-cap and non-tech focused, while anything associated with mega-caps was down. In a week when the Dow (DIA) was up over 2% and closed at an all-time high, the Nasdaq 100 (QQQ), S&P 100 (OEF), and even the S&P 500 (SPY) were all lower. The Nasdaq 100’s 2% decline moves that index not only below its 50-DMA but also into oversold territory. At the other extreme, smaller and mid-cap indices, along with the Dow, are at various degrees of overbought levels.
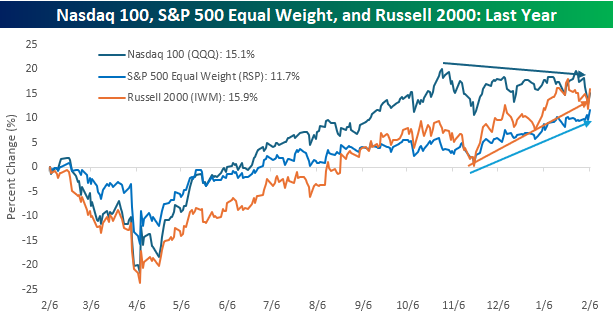
Looking at the performance of the Nasdaq 100, S&P 500 Equal Weight (RSP), and the Russell 2000 (IWM) ETFs over the last year shows an interesting shift. Since its peak last October, the Nasdaq 100 has been drifting lower while both the S&P 500 Equal Weight and Russell 2000 have rallied. The result is that the Russell 2000 is now outperforming the Nasdaq 100 over the last year, and the S&P 500 Equal Weight Index is rapidly closing the gap.
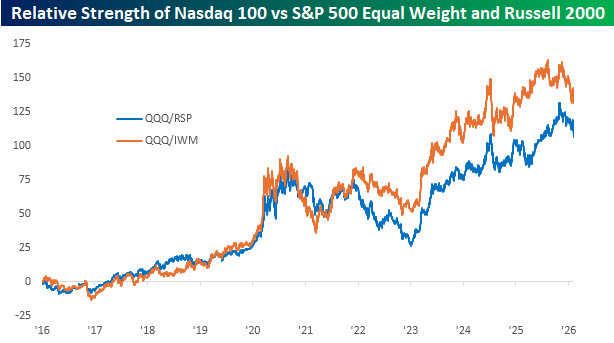
It’s been a rough three to four months for the mega-cap stocks relative to the rest of the market, but from a longer-term perspective, the recent underperformance of QQQ relative to RSP and IWM looks like much more benign as the longer-term trend remains intact. Whether that means this is just a temporary setback or that there’s much more mean reversion left in store remains to be seen, but for investors riding the mega-cap rally for the last several years are hanging on with white knuckles, hoping that, like the presidency of William Henry Harrison, this is a short stint.
Brunch Reads – 2/8/26
Welcome to Bespoke Brunch Reads — a linkfest of some of our favorite articles over the past week. The links are mostly market-related, but there are some other interesting subjects covered as well. We hope you enjoy the food for thought as a supplement to the research we provide you during the week.
“You Talkin To Me?”: On February 8, 1976, Taxi Driver opened in US theaters. The movie follows Travis Bickle, played by a young Robert De Niro, who is an insomniac Vietnam War veteran who takes a job as a New York City night-shift cab driver. Most of the film tracks his routine: endless nights cruising through Manhattan, listening to his own running commentary about the city’s crime and decay, and watching people from a distance without really connecting to them. He makes an awkward attempt at a relationship with Betsy, a campaign worker tied to a presidential candidate, but his social disconnect quickly sabotages it and deepens his resentment.
As Travis becomes more isolated, he starts fixating on the idea that the city needs to be “cleaned up,” a belief that slowly hardens into a personal mission. He begins physically training, buying guns, and rehearsing violent fantasies, convincing himself that he’s preparing for something meaningful rather than slipping further out of control.
It slowly becomes clear that his need for purpose has overtaken his ability to think rationally, and he sets his sights on a decisive act that he believes will finally give his life direction. What follows forces the audience to confront questions about violence, alienation, and how easily personal despair can be mistaken for righteousness.
Consumers & Retail
As American retail store anchors fade, private clubs are taking over more commercial real estate (CNBC)
As consumer spending splits along income lines, private membership clubs are anchoring shopping centers as retailers chase affluent, high-frequency visitors rather than broad foot traffic. Developers say these clubs fill large vacant spaces, generate steady dues-driven revenue, and keep members on-site longer, benefiting nearby dining, fitness, and luxury retail. The model is spreading from coastal cities to mid-sized markets, though its success depends on local wealth, density, and whether exclusivity can be sustained without overexpansion. [Link]
Continue reading our weekly Brunch Reads linkfest by logging in if you’re already a member or signing up for a trial to one of our two membership levels shown below! You can cancel at any time.

The Stats Behind Super Bowl Sunday
Below are some of the most interesting stats we came across related to this weekend’s Big Game. Enjoy!
Not a Bespoke client? Get serious about your market edge with Bespoke Premium, where data-driven research, historical context, and actionable insights help you cut through the noise and stay ahead of the tape. Join today to access our full suite of reports, stock baskets, and market analysis followed by professional and individual investors alike.
You can sign up for complimentary access for 14 days at this link to gain website access and start receiving our daily research emails right away!
Super Bowl Stocks
NFC Bulls. In the 30 years that the NFC won the Super Bowl, the S&P 500’s average gain for the rest of the year was 9.6%, with positive returns 77% of the time. In the 29 years that the AFC came out on top, the S&P 500’s average rest of year gain was 7.0%, with gains 72% of the time. (Source: Bespoke)
Seahawks! Win or Lose The Seahawks have previously appeared in 3 Super Bowls, winning one and losing two. In the two years they lost, the S&P 500 averaged a gain of 7.3% for the remainder of the year, with gains both times. After they won in 2014, the S&P 500 rallied 15.5% through year-end. (Source: Bespoke)
Go Pats! The Patriots already have the record for most Super Bowl appearances with 11, winning six and losing five. Following the six victories, the S&P 500’s average rest of year performance was a gain of 4.6%, with gains five times. After their five losses, the S&P 500’s average rest of year gain was 1.0%, with gains three out of five times. (Source: Bespoke)
Hoping For a Blowout. The S&P 500’s average rest of year gain after a Super Bowl blowout (21 or more points) has been 12.9%, with positive returns 12 out of 13 times. In the 10 years when the game was decided by a field goal or less, the S&P 500’s average rest of year gain was 3.1%, with positive returns 7 out of 10 times. (Source: Bespoke)
Bears Want Defense. When the total points scored in the Super Bowl was 60 or more, the S&P 500’s average rest of year gain was 12.3%, with gains 11 out of 12 times. When the total score was 30 or less, the S&P 500’s average rest of year gain was 5.7%, with positive returns just 4 out of 7 times. (Source: Bespoke)
Bowl Business
The “Big Game” Trademark Trap. Because the NFL strictly enforces its trademark on the term “Super Bowl,” thousands of businesses are legally forced to use the phrase “The Big Game” in advertisements to avoid multi-million dollar fines.
A $50,000 Icon. Despite the game generating billions in revenue, the Vince Lombardi Trophy, handcrafted by Tiffany & Co. over four months, is valued at only about $50,000, less than the weekly salary of many players on the field. (Source: FanDuel Research)
Sick Day Sunday. An estimated 16.1 million Americans plan on calling in sick to work the Monday after the Super Bowl, making it one of the least productive workdays of the year. (Source: The Journal Record)
A Lake of Beer. Americans will collectively consume enough beer on Super Bowl Sunday to fill 492 Olympic-sized swimming pools. (Source: Simpleview)
The Pizza Perimeter. If every pizza eaten on Super Bowl Sunday were lined up side-by-side, the chain would extend from New York City to Phoenix, Arizona. That’s roughly 2,368 miles of medium pizzas. (Source: Hungry Fan)
The “Crispy Equator” Consumption. For Super Bowl LX, Americans are projected to consume 1.48 billion chicken wings; if laid end-to-end, they would circle the Earth nearly three times. (Source: National Chicken Council)
The Big Feast. Super Bowl Sunday is the second-largest food consumption day in the U.S. after Thanksgiving. Americans consume over a billion chicken wings and tens of millions of pounds of snacks during the game. (Source: Barron’s)
Ads
For those that remember, the January 2000 Super Bowl ended up being dubbed “The Dot Com Bowl” because of all the internet commercials. That turned out to be poor timing because the Nasdaq was getting ready to hit its bubble peak in a couple months.
The February 2022 Super Bowl ended up being dubbed “The Crypto Bowl” because of all the crypto ads. That too turned out to be right around the time that crypto was peaking and stocks were entering a new bear market.
This year’s Super Bowl is expected to have quite a few AI ads. We can only hope it doesn’t get dubbed “The AI Bowl” based on the prior Dot Com and Crypto experiences!
The 20% Inventory Takeover. In 2000, 14 different companies with “.com” in their name bought airtime, accounting for nearly 20% of the total available ad spots. (Source: Wikipedia)
Betting the Entire Seed Round. The startup Computer.com famously spent $3 million of its $5.8 million in total seed funding on a single Super Bowl ad before the website had even officially launched. (Source: The Hustle)
A “Puppet” Production. The infamous Pets.com ad in 2000 required a massive production team of 150 people, 40 companies, and a 20-piece orchestra; the company liquidated and went defunct less than a year later. (Source: Sports Business Journal)
Irony in Retrospect. The FTX ad featuring Larry David in 2022 used the tagline “Don’t Miss Out,” a message that aged poorly when the exchange filed for bankruptcy just 10 months later. (Source: Bespoke)
The “Fortune Favors the Brave” Decline. Following Crypto.com’s high-profile ad featuring Matt Damon in 2022, the company’s native token (CRO) dropped approximately 83% in value within the following year. (Source: Bespoke)
Alexa, Play “For the Love of Money.” Amazon holds the record for the most expensive Super Bowl commercial with its Alexa Mind Reader ad in 2022 that ran 90 seconds and featured real-life couple Scarlett Johansson and Colin Jost. The cost to produce and air the ad was $26 million. (Source: Qualtrics)
The Game
Not Super at First. The first Super Bowl in 1967 was not even called the “Super Bowl” at the time; it was officially titled the “AFL-NFL World Championship Game,” a name that was later scrapped for having “no ring to it.”
Looking to Even the Score. Through the first 59 Super Bowls, the NFC has won 30 times versus the AFC’s 29. Since the Packers won Super Bowl I, the two conferences have only been tied in the number of championships five times, and in the 29-year stretch from 1991 through 2019, the NFC held the title lead. (Source: Bespoke)
Rematch. Super Bowl LX is the 11th rematch between two teams who previously played each other in a prior Super Bowl. In the ten prior occurrences, the winner of the ‘rematch’ was the same as the previous winner six times. (Source: Bespoke)
The 108-Ball Handcraft. Wilson Sporting Goods hand-stitches exactly 108 footballs for each team (54 for practice and 54 for the game), each one specially stamped with the “Commissioner” signature and the Super Bowl logo. (Source: CBS News)
The White Jersey Advantage. In a strange statistical trend, teams wearing white jerseys have won 16 of the last 21 Super Bowls and hold a 37-22 overall record in the big game. (Source: Sports Illustrated)
The Losing MVP. Only one player in history—Cowboys linebacker Chuck Howley in 1971—has ever won the Super Bowl MVP award while playing for the losing team. (Source: Wikipedia)
A “Worst to First” Record. The 2026 New England Patriots are the first team in NFL history to reach the Super Bowl immediately following a season in which they lost 13 or more games. (Source: CBS Sports)
The 34-Minute Blackout. In 2013, Super Bowl XLVII was famously suspended for 34 minutes due to a partial power failure in the Superdome, an event that became a marketing goldmine for Oreo, which tweeted “You can still dunk in the dark” during the delay. (Source: Digiday)
Gridiron Gridlock. Only two Super Bowls have ever gone to OT, both in the last decade. It took more than 50 years to get to a Super Bowl OT. The first came in Super Bowl LI, when the Patriots came back from down 28-3 against the Falcons. The second was when the Chiefs came from behind against the 49ers in Super Bowl LVIII. (Source: DraftKings)
House Call. Devin Hester opened Super Bowl XLI by returning the opening kickoff 92 yards for a touchdown — the only opening kickoff return TD in Super Bowl history. There has never been a punt returned for a TD in a Super Bowl. (Source: Pro Football Hall of Fame)
Safety First. The first score in Super Bowl IX was a safety, the first in Super Bowl history, due to a botched snap. (Source: SB Nation)
Bets
The “Omaha” Over/Under. In 2014, sportsbooks set an over/under line of 27.5 on how many times Peyton Manning would shout his signature “Omaha” cadence; he said it 44 times, leading to a massive “Over” payout that forced books to rethink cadence betting. (Source: New York Post)
The “Fridge” Payout. In 1986, Caesars Palace offered 20-1 odds that 335-pound William “The Refrigerator” Perry would score a touchdown; the public bet so heavily on the “Yes” that his third-quarter score cost Vegas over $100,000 on a single player prop. (Source: ESPN)
The Gatorade “No-Show.” In 2021, bettors were stunned when no Gatorade was poured on the winning coach, sparking a massive controversy in the betting community as “No Gatorade” was not an option on many prop sheets. (Source: Yahoo Sports)
The Preseason Longshots. The 2026 matchup (Patriots vs. Seahawks) is the first since 1981 to feature two teams that both had preseason odds of 50-1 or longer to make the game. (Source: CBS Sports)
The Crossover King. In 1990, a “cross-sport” prop bet asked if the 49ers would score more points than Michael Jordan would for the Bulls on that same day; the 49ers won the bet by outscoring “His Airness” 55-39. (Source: Audacy)
Halftime
The Disney Marketing Gimmick. In 1995, the halftime show was an elaborate Indiana Jones-themed stunt used primarily to promote a new theme park ride, featuring impersonators rather than the actual actors. You can watch it here. (Source: Yahoo)
The “Super Flush” Phenomenon. Municipalities often see a massive surge in water usage during the Super Bowl halftime; in some years, the volume of water used simultaneously is equivalent to seven minutes of flow over Niagara Falls. (Source: San Jose Water)
The Unplugged Performance. During the 2014 halftime show, eagle-eyed fans noticed that Flea of the Red Hot Chili Peppers was “playing” a bass guitar that wasn’t actually plugged into anything, later confirming the band had pre-recorded the instruments for better audio quality. (Source: Time Magazine)
Not a Bespoke client? Get serious about your market edge with Bespoke Premium, where data-driven research, historical context, and actionable insights help you cut through the noise and stay ahead of the tape. Join today to access our full suite of reports, stock baskets, and market analysis followed by professional and individual investors alike.
You can sign up for complimentary access for 14 days at this link to gain website access and start receiving our daily research emails right away!

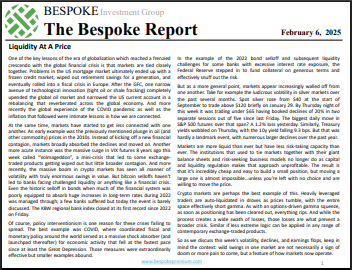
The Bespoke Report – 2/6/26 – Liquidity At A Price
To read our weekly Bespoke Report newsletter and access everything else Bespoke’s research platform offers, start a two-week trial to Bespoke Premium. Liquidity, liquidity everywhere, but not a bid to hit. This week we talk through the phenomenon of volatility everywhere which refuses to spill into a broader cross-asset selloff. It was a wild week for crypto, commodities, and software companies and we discuss all three as well as the rotation from growth to value, performance of thematic baskets, a comprehensive review of major earnings reports this week, an update on the performance of earnings season so far, notable economic data this week, and much more.

Daily Sector Snapshot — 2/6/26
Bespoke’s Morning Lineup – 2/6/26 – Stayin’ Alive
See what’s driving market performance around the world in today’s Morning Lineup. Bespoke’s Morning Lineup is the best way to start your trading day. Read it now by starting a two-week trial to Bespoke Premium. CLICK HERE to learn more and start your trial.
“I have wondered at times what the Ten Commandments would have looked like if Moses had run them through the US Congress.” – Ronald Reagan
Below is a snippet of commentary from today’s Morning Lineup. Start a two-week trial to Bespoke Premium to view the full report.
It’s been a rough week for bulls, but they’re trying to end the week on a positive note. Let’s just see if they have enough firepower to keep the market up through the trading day. The S&P 500 and Nasdaq are both on pace to open up by about 0.50%, even with Amazon.com (AMZN) trading down 7.5%. Even with the gains, treasury yields are down modestly, with the 10-year yield at 4.2%, so there’s still a good amount of trepidation out there.
Crude oil is also down fractionally, with WTI trading down to $63. The precious metals stocks have been surprisingly calm this morning, at least relatively speaking. Gold is up 0.7% while silver and platinum are both down about 3%. And hold onto your hats for a second, Bitcoin is trading higher! After touching $60K overnight, Bitcoin is up 5% to just above $66K.
In Asia overnight, the Nikkei traded up 0.8% and finished the week up 1.8%, but every other major index in the region finished down for the week, and except India, they were also all down on Friday. The weakness in Asia hasn’t followed through to Europe, though. The STOXX 600 is up 0.4%, which will keep it in positive territory for the week.
In the US today, the only economic reports on the calendar are Michigan Sentiment at 10 AM (who knows how they’ll be feeling this month) and then Consumer Credit at 3 PM.
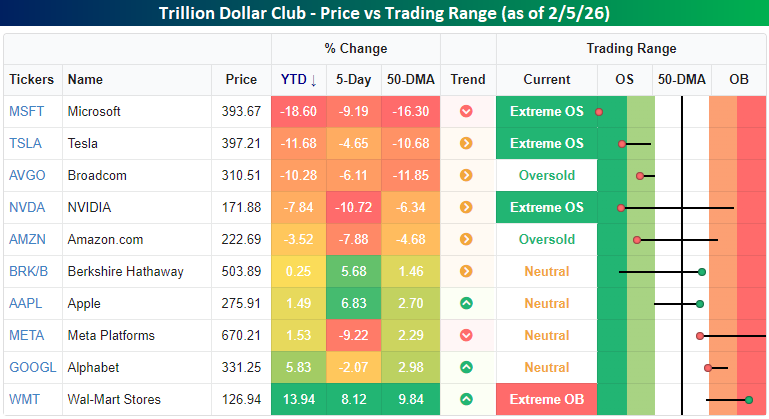
It’s well established that the trillion-dollar market cap stocks no longer trade as a monolith to the upside, but unfortunately for bulls, it looks increasingly like they trade in unison to the downside. On a YTD basis, there’s plenty of dispersion in performance. Among the group’s worst performers, we’re less than a week into February, but Microsoft (MSFT), Tesla (TSLA), and Broadcom (AVGO) are all down over 10% YTD. Another two stocks – Nvidia (NVDA) and Amazon.com (AMZN) are down YTD (AMZN will be down over 10% at the open this morning). On the upside, the gains aren’t nearly as large as the losses, but Wal-Mart (WMT) has managed to gain close to 14% while Alphabet (GOOGL) managed to hang on to a gain of over 5% after yesterday’s intraday bounce.
Over the last five trading days, the trillion-dollar stocks have traded more in tandem. Seven of the ten listed are down over the last week, and most are down over 5%. At the other extreme, the gainers have also moved over 5%, so it’s mostly been an either-or situation for the group, with most stocks taking the “or” path.
As mentioned above, GOOGL was on pace for a much larger decline yesterday, following its incredible boost to CapEx guidance on Wednesday. Shortly after the open, the stock was down over 8% and well below its 50-DMA, but buyers stepped in throughout the trading day, and the stock finished down less than 1% and outperformed all of the major US equity indices in the process. Yes, GOOGL was actually a positive (or less negative) contributor to yesterday’s market performance!
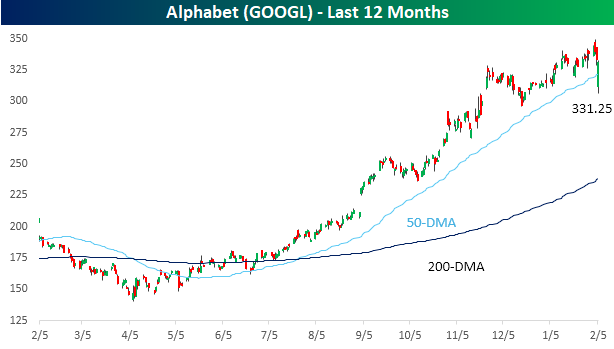
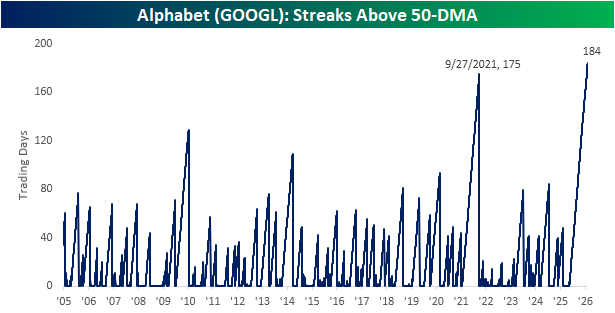
With GOOGL rallying throughout the day, it also extended its record streak of closes above its 50-DMA. At 184 trading days, GOOGL hasn’t traded below its 50-DMA since May 1st! Before the current streak, the prior record of closes above the 50-DMA ended at 175 trading days in September 2021.
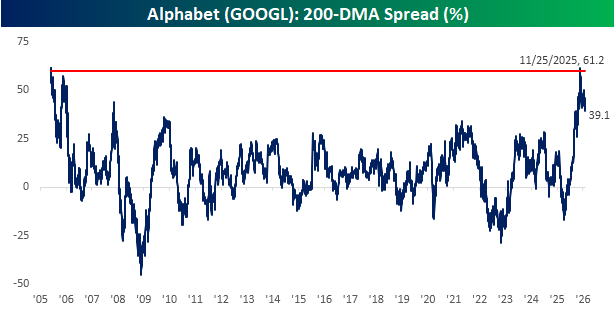
What you’ll also notice looking at GOOGL’s price chart is how much space there is between the stock’s price and its 200-DMA. As of yesterday’s close, GOOGL was 39.1% above its 200-DMA, which is among the highest readings on record, Even more incredible is that in late November, it was more than 60% above its 200-DMA, which was right up there with the record high spread of 61.7% from way back in June 2005, less than a year after the stock’s IPO.
It’s a stunning reversal from just a year ago, when the stock languished well below its 200-DMA and investors criticized the company for “missing AI”. Headlines suggested an existential crisis. Clearly, the market has made up for lost time.
The Closer – Crypto Crash, Value vs. Growth, Data Day – 2/5/26
Log-in here if you’re a member with access to the Closer.
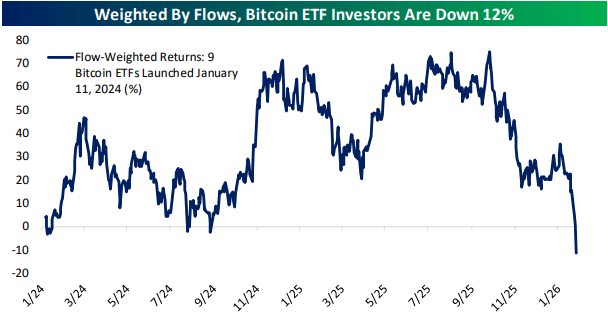
Looking for deeper insight into markets? In tonight’s Closer sent to Bespoke Institutional clients, we start out with a look into the crypto crash including some insights into how severe crypto ETF losses have gotten (pages 1 and 2). We also review the pain in the AI trade and massive outperformance of value versus growth (page 3). Afterward, we switch to economic data including the latest JOLTS release (pages 4 and 5) and jobless claims (page 6). Following a review of tonight’s earnings (page 7), we close out with an update on housing data (pages 8 and 9).
See today’s full post-market Closer and everything else Bespoke publishes by starting a 14-day trial to Bespoke Institutional today!
The Triple Play Report: 2/4/26 Before the Open
An earnings triple play is a stock that reports earnings and manages to 1) beat analyst EPS estimates, 2) beat analyst sales estimates, and 3) raise forward guidance. You can read more about “triple plays” at Investopedia.com where they’ve given Bespoke credit for popularizing the term. We like triple plays as an indication that a company’s business is firing on all cylinders, with better-than-expected results and an improving outlook. A triple play is indicative of positive “fundamental momentum” instead of pure fundamentals, and there are always plenty of names with both high and low valuations on our quarterly list.
Bespoke’s Triple Play Report covers what each company does, what this quarter’s results say about their growth outlooks, and their histories of delivering triple plays. Bespoke’s Triple Play Report is available at the Bespoke Institutional level only. You can sign up for Bespoke Institutional now and receive a 14-day trial to read today’s Triple Play Report. To sign up, choose either the monthly or annual checkout link below:
Bespoke Institutional – Monthly Payment Plan
Bespoke Institutional – Annual Payment Plan
Bespoke Investment Group, LLC believes all information contained in these reports to be accurate, but we do not guarantee its accuracy. None of the information in these reports or any opinions expressed constitutes a solicitation of the purchase or sale of any securities or commodities. This is not personalized advice. Investors should do their own research and/or work with an investment professional when making portfolio decisions. As always, past performance of any investment is not a guarantee of future results. Bespoke representatives or clients may have positions in securities discussed or mentioned in its published content.
Average Software Stock Now Down Since Tariff Tantrum Lows
The Deepseek sell-off late last January, followed by the tariff tantrum in early April, caused US stocks to plummet. From peak to trough, the S&P 500 fell 19% on a closing basis, just shy of bear market territory, while the Tech-heavy Nasdaq 100 fell 23%.
Once the Trump administration reined in its horns on tariffs, the market flew higher. The six months following the tariff-tantrum low on April 8th was one of the strongest six-month moves in the market’s history (+35%), but equities have basically been flat since that six-month move that ended last October.
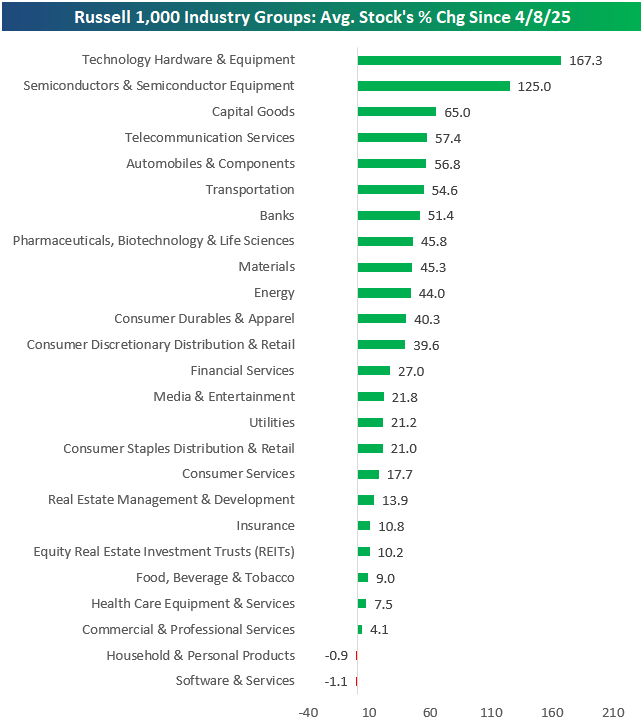
The average stock in the Russell 1,000 is still up roughly 37% since the April 8th tariff-tantrum low, but performance across industry groups has been eye-opening.
As shown below, after the sell-off we’ve seen in software names recently due to the perceived threat from AI, the average stock in the Software & Services group is now down since the April 8th low! The average Household & Personal Products stock is also down since then, but these stocks have actually been flying in the last couple of weeks as software sells off.
Amazingly, while software is in the red since Trump’s tariff turmoil, the two groups where stocks are up the most are in the hardware space. Tech Hardware & Equipment stocks are still up an average of 167% since 4/8/25, while Semis are up 125%. That’s basically double the next best group — Capital Goods (+65%).
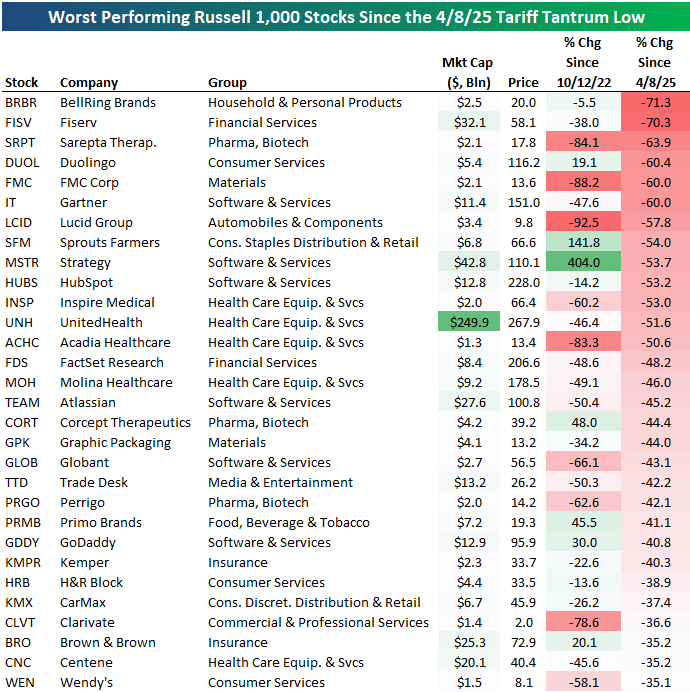
About 23% of Russell 1,000 stocks are lower today than they were at the close on 4/8/25.
Below are the 30 stocks in the index that are down the most: