Chart of the Day – History in the Making
The Triple Play Report: 2/5/26 After the Close
An earnings triple play is a stock that reports earnings and manages to 1) beat analyst EPS estimates, 2) beat analyst sales estimates, and 3) raise forward guidance. You can read more about “triple plays” at Investopedia.com where they’ve given Bespoke credit for popularizing the term. We like triple plays as an indication that a company’s business is firing on all cylinders, with better-than-expected results and an improving outlook. A triple play is indicative of positive “fundamental momentum” instead of pure fundamentals, and there are always plenty of names with both high and low valuations on our quarterly list.
Bespoke’s Triple Play Report covers what each company does, what this quarter’s results say about their growth outlooks, and their histories of delivering triple plays. Bespoke’s Triple Play Report is available at the Bespoke Institutional level only. You can sign up for Bespoke Institutional now and receive a 14-day trial to read today’s Triple Play Report. To sign up, choose either the monthly or annual checkout link below:
Bespoke Institutional – Monthly Payment Plan
Bespoke Institutional – Annual Payment Plan
Bespoke Investment Group, LLC believes all information contained in these reports to be accurate, but we do not guarantee its accuracy. None of the information in these reports or any opinions expressed constitutes a solicitation of the purchase or sale of any securities or commodities. This is not personalized advice. Investors should do their own research and/or work with an investment professional when making portfolio decisions. As always, past performance of any investment is not a guarantee of future results. Bespoke representatives or clients may have positions in securities discussed or mentioned in its published content.
The Triple Play Report: 2/5/26 Before the Open
An earnings triple play is a stock that reports earnings and manages to 1) beat analyst EPS estimates, 2) beat analyst sales estimates, and 3) raise forward guidance. You can read more about “triple plays” at Investopedia.com where they’ve given Bespoke credit for popularizing the term. We like triple plays as an indication that a company’s business is firing on all cylinders, with better-than-expected results and an improving outlook. A triple play is indicative of positive “fundamental momentum” instead of pure fundamentals, and there are always plenty of names with both high and low valuations on our quarterly list.
Bespoke’s Triple Play Report covers what each company does, what this quarter’s results say about their growth outlooks, and their histories of delivering triple plays. Bespoke’s Triple Play Report is available at the Bespoke Institutional level only. You can sign up for Bespoke Institutional now and receive a 14-day trial to read today’s Triple Play Report. To sign up, choose either the monthly or annual checkout link below:
Bespoke Institutional – Monthly Payment Plan
Bespoke Institutional – Annual Payment Plan
Bespoke Investment Group, LLC believes all information contained in these reports to be accurate, but we do not guarantee its accuracy. None of the information in these reports or any opinions expressed constitutes a solicitation of the purchase or sale of any securities or commodities. This is not personalized advice. Investors should do their own research and/or work with an investment professional when making portfolio decisions. As always, past performance of any investment is not a guarantee of future results. Bespoke representatives or clients may have positions in securities discussed or mentioned in its published content.
The Triple Play Report: 2/4/26 After the Close
An earnings triple play is a stock that reports earnings and manages to 1) beat analyst EPS estimates, 2) beat analyst sales estimates, and 3) raise forward guidance. You can read more about “triple plays” at Investopedia.com where they’ve given Bespoke credit for popularizing the term. We like triple plays as an indication that a company’s business is firing on all cylinders, with better-than-expected results and an improving outlook. A triple play is indicative of positive “fundamental momentum” instead of pure fundamentals, and there are always plenty of names with both high and low valuations on our quarterly list.
Bespoke’s Triple Play Report covers what each company does, what this quarter’s results say about their growth outlooks, and their histories of delivering triple plays. Bespoke’s Triple Play Report is available at the Bespoke Institutional level only. You can sign up for Bespoke Institutional now and receive a 14-day trial to read today’s Triple Play Report. To sign up, choose either the monthly or annual checkout link below:
Bespoke Institutional – Monthly Payment Plan
Bespoke Institutional – Annual Payment Plan
Bespoke Investment Group, LLC believes all information contained in these reports to be accurate, but we do not guarantee its accuracy. None of the information in these reports or any opinions expressed constitutes a solicitation of the purchase or sale of any securities or commodities. This is not personalized advice. Investors should do their own research and/or work with an investment professional when making portfolio decisions. As always, past performance of any investment is not a guarantee of future results. Bespoke representatives or clients may have positions in securities discussed or mentioned in its published content.
Bespoke’s Morning Lineup – 2/10/26 – Software Investors Become More “Choiceful”
See what’s driving market performance around the world in today’s Morning Lineup. Bespoke’s Morning Lineup is the best way to start your trading day. Read it now by starting a two-week trial to Bespoke Premium. CLICK HERE to learn more and start your trial.
“We are all wrong so often that it amazes me that we can have any conviction at all over the direction of things to come.” – Jim Cramer

Below is a snippet of commentary from today’s Morning Lineup. Start a two-week trial to Bespoke Premium to view the full report.
After two big days of gains, investors are taking some profits this morning as futures on the major averages are all down a modest 0.2% or less. Bonds are catching a bid, though, as the 10-year yield is all the way down to 4.17% after testing 4.3% yesterday. Oil prices are modestly higher, while precious metals are modestly lower, with gold and silver each down less than 1%. When was the last time each of those moved under 1% on the same day?
In international markets, Asia was positive with Japan surging another 2%, while other major benchmarks were all up less than 0.5%. In Europe, the tone is also modestly positive, with the STOXX 600 up 0.1% while no other major benchmark is up or down more than 0.3%.
In the US today, small business sentiment unexpectedly fell in January, and at 8:30, we got the latest reports on the Employment Cost Index and Retail Sales. ECI was weaker than expected, and Retail Sales (for December) came in well below forecasts.
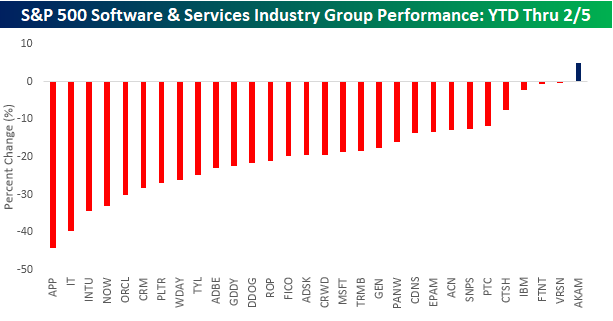
Through last Thursday’s close, the S&P 500 Software and Services Group was easily the worst-performing industry group in the S&P 500. With a decline of over 20% YTD, the group was down more than twice as much as the next closest group (Autos & Auto Parts). Over the last two days, Software has bounced back sharply, rallying more than 5%, but Semiconductors, which weren’t down nearly as much YTD heading into last Friday, are up by more than 8%!
Within the Software group, we wanted to look at which stocks led it to the downside and whether the rebound has been a reversal of the YTD trend or have investors become more discerning, trying to decipher the winners from the losers. The chart below shows the YTD performance of the industry group’s components through last Thursday’s close. Leading the way down was AppLovin (APP), which was down a staggering 44% through last Thursday. Along with APP, Gartner (IT), Intuit (INTU), ServiceNow (NOW), and Oracle (ORCL) were all down 30% for the year! In terms of winners, there practically weren’t any as Akamai (AKAM) was the lone stock in the group up YTD.
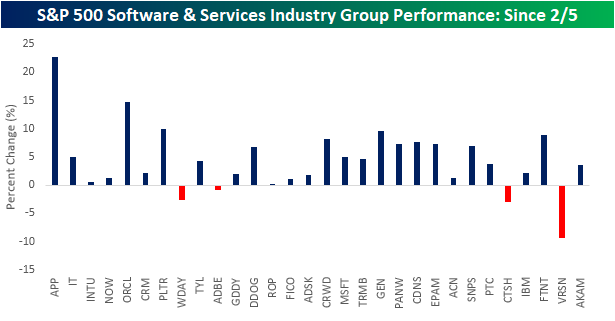
After sharp declines like we have seen in software stocks this year, when you see a bounce, it’s usually the biggest losers that bounce the most, while the stocks that held up the best don’t see nearly the juice. Based on that logic, you would expect the stocks mentioned above that were down 30% YTD to be up the most over the last two days, while a stock like AKAM would underperform. Looking at how the group’s stocks have performed in the last two trading days, that hasn’t exactly played out.
With gains of 22.7% and 14.7% since last Thursday’s close, APP and ORCL have been two of the best performers during the current bounce, but the other three stocks that were down over 30% have all either performed in line with or below the average performance of stocks in the group. At the other end of the spectrum, even after rallying YTD through last Thursday, AKAM still managed to rally in the last two trading days. Not only that, but stocks in the group that held up relatively well during the pullback this year have also outperformed on the way up.
The fact that we haven’t simply seen the biggest losers YTD bounce the most over the last two trading days, and vice versa, can be interpreted as a healthy sign suggesting that rather than indiscriminately going in and buying whatever is down the most, investors have been more discerning in their actions, attempting to weed out the ultimate winners and losers. Whether they end up being right is a big if, but it still strikes us as a healthy sign.
The Closer – Alphabonds, Flow Show, Expectations – 2/9/26
Log-in here if you’re a member with access to the Closer.
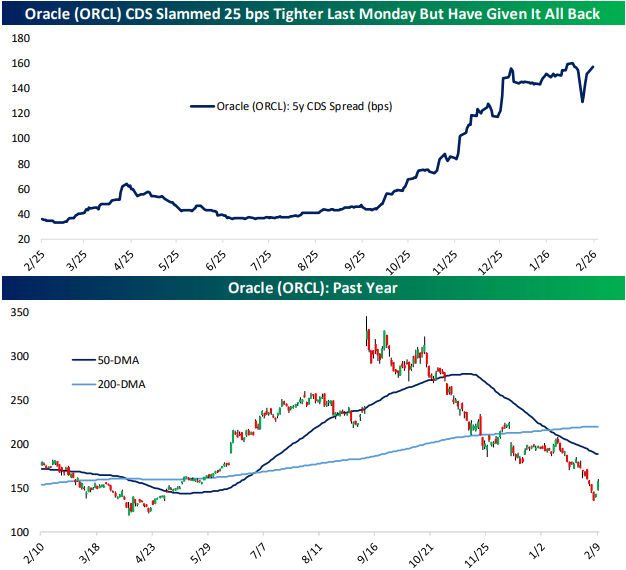
Looking for deeper insight into markets? In tonight’s Closer sent to Bespoke Institutional clients, we lead off with a look at the sale of $20bn of debt from Alphabet (GOOGL) in addition to an update on Oracle (ORCL) credit spreads (page 1). Next up, we show the bounce in AI driven names (page 2). We then recap the latest findings of the New York Fed’s Survey of Consumer Expectations (pages 3 and 4) before capping off with a review of the latest positioning data (pages 5 and 6).
See today’s full post-market Closer and everything else Bespoke publishes by starting a 14-day trial to Bespoke Institutional today!
Daily Sector Snapshot — 2/9/26
January 2026 Headlines
Will Analysts Start Downgrading Software?
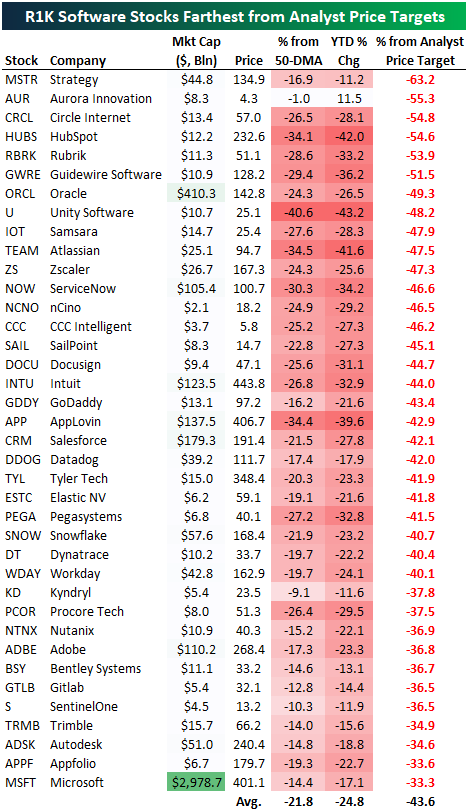
Because of the recent plunge in the group, the average software stock in the Russell 1,000 needs to gain more than 50% to get back to its consensus analyst price target! The rapidity of the decline hasn’t given analysts who cover the group time to catch up to the downside. With share prices now dramatically lower than price targets, analysts have to decide whether to hold firm or start cutting estimates.
Below is a list of the Russell 1,000 software stocks that are now the farthest below their average analyst price targets. Strategy (MSTR) is the farthest below its average price target at 63%, followed by another five stocks that are more than 50% below: Aurora (AUR), Circle (CRCL), Hubspot (HUBS), Rubrik (RBRK), and Guidewire (GWRE).
Oracle (ORCL) came into the week trading at $142.80, but analysts covering the stock still have an average price target of $282, or nearly double that level. Other large software stocks with $100+ billion market caps that are at least 33% below their price targets include ServiceNow (NOW), Intuit (INTU), AppLovin (APP), Salesforce (CRM), Adobe (ADBE), and Microsoft (MSFT).
As shown below, the software stocks listed came into the week down an average of 24.8% year-to-date and 21.8% below their 50-day moving averages.
Unless share prices have a quick V-shaped recovery, analysts will likely be forced to start lowering price targets, which would potentially act as a further headwind.

Software Getting Skinny
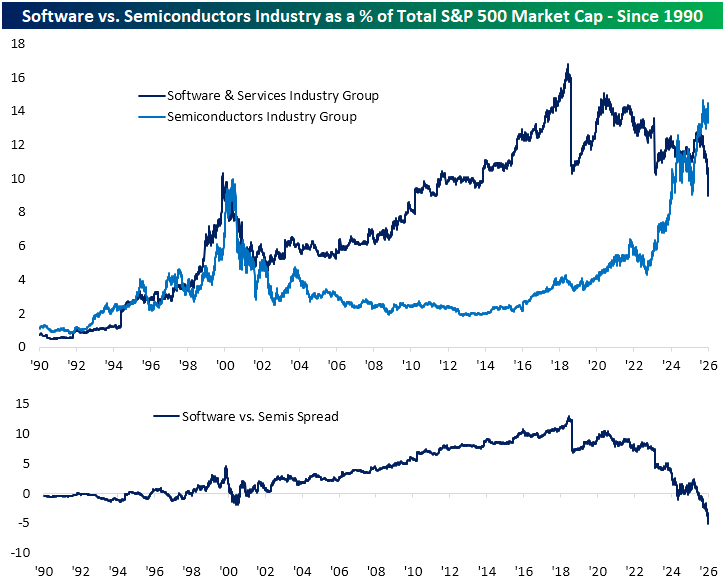
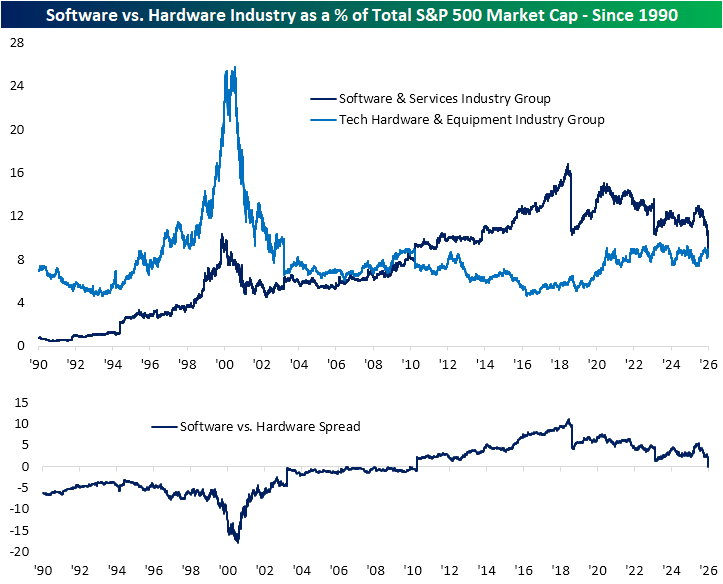
In the past couple of weeks, we have repeatedly highlighted the weakness in the software stocks. Fears that AI will pose a significant threat to the sector have caused large losses in terms of both price and weighting. In the charts below, we show the industry’s weighting in the S&P 500 versus other industries within the Tech sector. Last Thursday, the Software and Services industry saw its market cap as a share of total S&P 500 market cap fall below 9% for the first time since July 24, 2011. A significant portion of that drop has come from a dramatic move over the past several months; however, that is also in the context of a longer-term drawdown since the peak weighting in the summer of 2018, shortly before a reclassification that shifted several large-cap Tech names into other sectors.
The recent declines also put the software industry’s weighting on par with one of its peers in the Tech sector: the Tech Hardware and Equipment industry. In fact, at the low last Thursday, Software saw its weighting in the S&P 500 fall below that of Tech Hardware and Equipment for the first time since April 30, 2010. Whereas there have been steadier trends in software weighting over the long run, Hardware and Equipment has seen a relatively stable range of readings in the mid to high single digits since the early 2000s. That followed extremely elevated weights that crossed into the mid-20% range during the height of the Dot Com era. Fast forward back to today, even with the lower weighting in Software recently, Tech hardware hasn’t been picking up much.
The third and final industry that comprises the Tech sector is Semiconductors, and its weight trend is the polar opposite. This is a group that has been an absolute star of the show since AI came to the mainstream in late 2022, and as a result, it is now hovering around a record share of the S&P 500’s market cap. Today, its weight is up to 14.3%, which is again still a far cry from the Tech Hardware and Equipment Industry over a quarter century ago. That also leaves software in the dust as there is now a record 5 percentage-point difference in the weightings of the two industry groups.