Daily Sector Snapshot — 2/11/26
The Triple Play Report: 2/10/26
An earnings triple play is a stock that reports earnings and manages to 1) beat analyst EPS estimates, 2) beat analyst sales estimates, and 3) raise forward guidance. You can read more about “triple plays” at Investopedia.com where they’ve given Bespoke credit for popularizing the term. We like triple plays as an indication that a company’s business is firing on all cylinders, with better-than-expected results and an improving outlook. A triple play is indicative of positive “fundamental momentum” instead of pure fundamentals, and there are always plenty of names with both high and low valuations on our quarterly list.
Bespoke’s Triple Play Report covers what each company does, what this quarter’s results say about their growth outlooks, and their histories of delivering triple plays. Bespoke’s Triple Play Report is available at the Bespoke Institutional level only. You can sign up for Bespoke Institutional now and receive a 14-day trial to read today’s Triple Play Report. To sign up, choose either the monthly or annual checkout link below:
Bespoke Institutional – Monthly Payment Plan
Bespoke Institutional – Annual Payment Plan
Bespoke Investment Group, LLC believes all information contained in these reports to be accurate, but we do not guarantee its accuracy. None of the information in these reports or any opinions expressed constitutes a solicitation of the purchase or sale of any securities or commodities. This is not personalized advice. Investors should do their own research and/or work with an investment professional when making portfolio decisions. As always, past performance of any investment is not a guarantee of future results. Bespoke representatives or clients may have positions in securities discussed or mentioned in its published content.
Chart of the Day – Small Weights Gets Extremely Extended
Bespoke’s Morning Lineup – 2/11/26 – Boring is Beautiful (Mostly)
See what’s driving market performance around the world in today’s Morning Lineup. Bespoke’s Morning Lineup is the best way to start your trading day. Read it now by starting a two-week trial to Bespoke Premium. CLICK HERE to learn more and start your trial.
“The greatest minds are capable of the greatest vices as well as of the greatest virtues.” – Rene Descartes

Below is a snippet of commentary from today’s Morning Lineup. Start a two-week trial to Bespoke Premium to view the full report.
Anticipation is the word of the morning, as markets waited for the delayed January jobs report. Heading into the report, S&P 500, Nasdaq, and Dow futures were all up a modest 0.10%. The 10-year yield was down a basis point to 4.13%, and crude oil was up over 2% and back above $65 per barrel. Precious metals are back in rally mode as gold rallies 1.5%, silver surges 6%, and Platinum rises 4%. Crypto, meanwhile, is struggling as Bitcoin pulls back 3% and trades back below $67. Metals rallying, crypto falling? Looks like things are getting back to normal!
The January payrolls report just hit the tape, and it was higher across the board. Non-Farm Payrolls were twice as much as expected (130K vs 65K), while the Unemployment Rate dropped to 4.3% 4.4% expected. Average hourly earnings and the average workweek were also both higher than expected. In response to the report, the 10-year yield ripped higher to just under 4.2% while equity futures added to their gains.
Japan was closed overnight, but most other major benchmarks in the region finished the session higher, with Australia rallying 1.6% while South Korea added another 1.0%. South Korea reported an 44.4% y/y increase in exports during the first ten days of February, aided by a 138% increase in chip exports. In China, January CPI came in weaker than expected, rising 0.2% versus an expected 0.3% increase.
In Europe, the STOXX 600 isn’t closed, but it’s unchanged on the session. The FTSE 100 is up nearly 1%, but every other major benchmark in the region is lower. It’s been a quiet session in terms of economic data, with Italian Industrial Production (better than expected) being the only major report on the calendar.
If I told you that software stocks had lost a third of their value over the last five months, you’d say the Nasdaq was in a deep correction, at minimum. Conversely, if I told you that the number of stocks hitting new 52-week highs was routinely at the highest levels in at least a year, you’d be asking when the Nasdaq crossed 25,000. Well, both trends outlined above have played out, but neither assumed result has played out for the Nasdaq, as both forces have essentially cancelled each other out, creating a period of stasis that has been going on for the last five months.
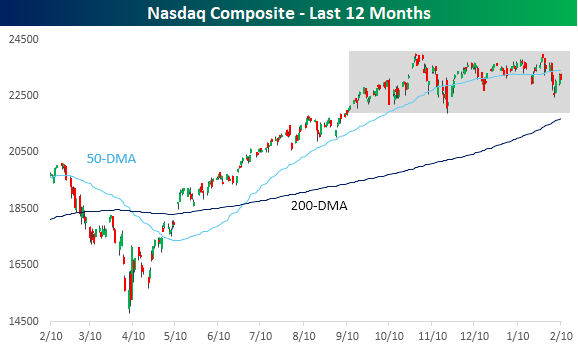
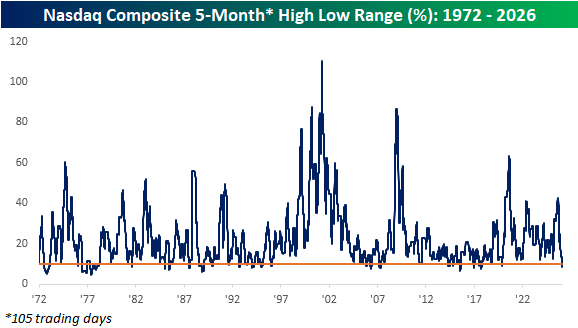
With the Nasdaq basically going nowhere since September, the spread between the index’s closing high and low recently dropped below 10%, and as of yesterday’s close, it was just 8.7%. That’s the first time that the five-month trading range dropped below 10% since 2019, and the narrowest range since October 2017. Back in the mid-teens, the Nasdaq’s five-month range was routinely below 10%, but since 1972, it has only occurred on less than 10% of all trading days.
The Closer – Earnings, Labor Data, Trading Range – 2/10/26
Log-in here if you’re a member with access to the Closer.
Looking for deeper insight into markets? In tonight’s Closer sent to Bespoke Institutional clients, we kick off with a review of the latest labor market data including ADP and ECI figures (page 1). Then we recap the latest retail sales report the day’s Fedspeak (page 2). Next up is a recap of the latest earnings reports including those results from Ford (F), Lyft (LYFT), Robinhood (HOOD), and more (page 3). We then give a follow up on today’s Chart of the Day in looking at that S&P 500’s tight trading range (page 4) before capping off with an update of the latest sentiment data (page 5).
See today’s full post-market Closer and everything else Bespoke publishes by starting a 14-day trial to Bespoke Institutional today!
Daily Sector Snapshot — 2/10/26
Long Bulls
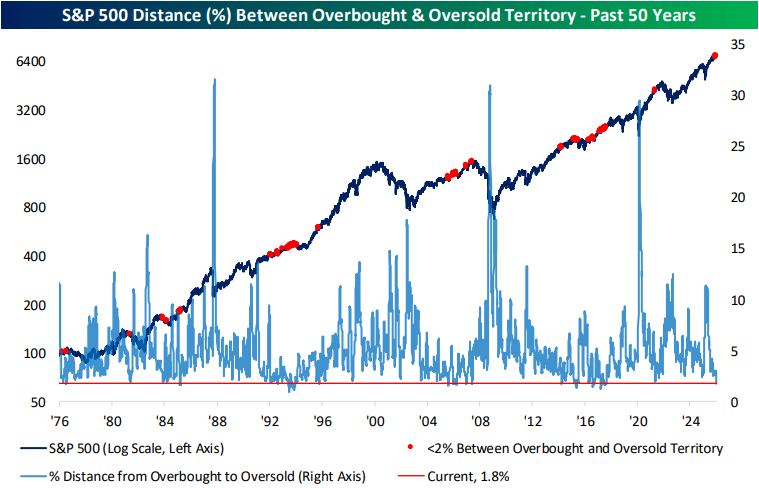
With the S&P 500’s new all-time closing high on 1/27, the current bull market — which we’ve dubbed the “AI Bull” — extended to more than 1,200 days.
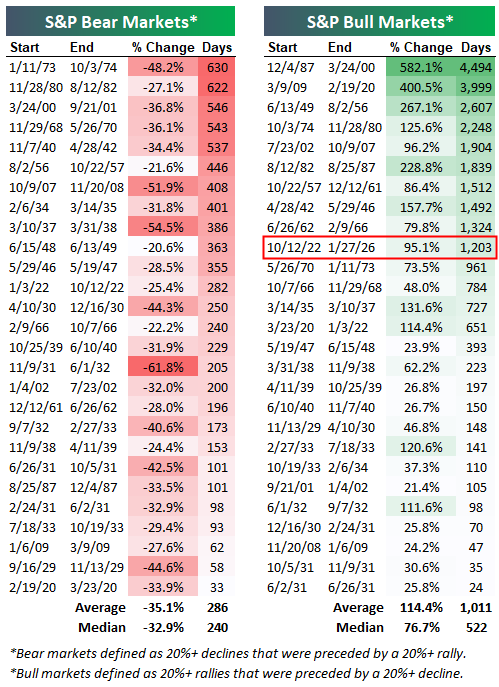
Below is a look at historical bull and bear markets for the S&P since 1928 using the standard 20% rally/decline threshold (on a closing basis).
This is the 10th bull market that has lasted 1,000+ days, with the longest bull being the 4,494-day stretch from December 1987 to March 2000. (Yes, there was not a single time during that period where the S&P 500 fell 20% on a closing basis.)
While we’re well past the average bull market in terms of length, there’s plenty of historical precedent for the run to go on much longer.
Additionally, it’s helpful to point out that bull markets are typically much longer than bears. The average bull has lasted 1,011 days versus just 286 days for the average bear. The two longest bear markets were 630 days (1/11/73-10/3/74) and 622 days (11/28/80-8/12/82). There have been 14 bull markets that lasted longer than the longest bear markets.
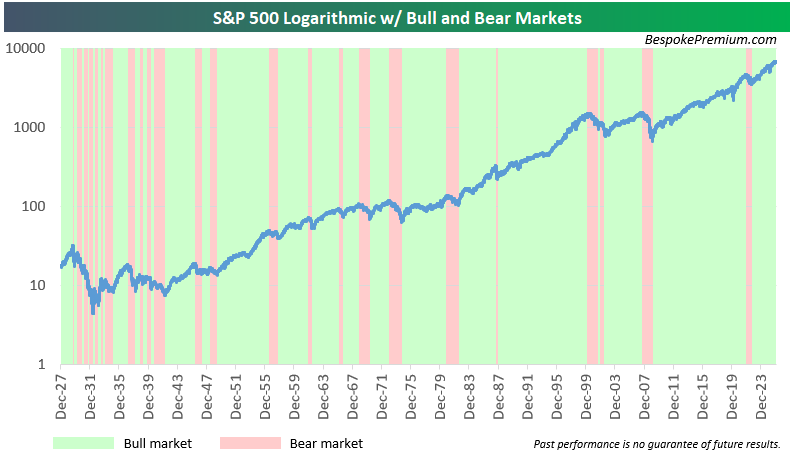
Green shading in the chart below shows S&P 500 bull markets, while red shading shows bear markets. This is another excellent way to visualize how bull markets are typically very lengthy with a steady uptrend, while bear markets are short and violent.
Want to learn more about market cycles and what drives them? Become a Bespoke subscriber to start receiving our daily reports and become a more informed investor. Click here or on the image below to learn more.

The Triple Play Report: 2/6/26 & 2/9/26
An earnings triple play is a stock that reports earnings and manages to 1) beat analyst EPS estimates, 2) beat analyst sales estimates, and 3) raise forward guidance. You can read more about “triple plays” at Investopedia.com where they’ve given Bespoke credit for popularizing the term. We like triple plays as an indication that a company’s business is firing on all cylinders, with better-than-expected results and an improving outlook. A triple play is indicative of positive “fundamental momentum” instead of pure fundamentals, and there are always plenty of names with both high and low valuations on our quarterly list.
Bespoke’s Triple Play Report covers recent earnings triple plays featuring what each company does, what this quarter’s results say about their growth outlooks, and their histories of delivering triple plays. Bespoke’s Triple Play Report is available at the Bespoke Institutional level only. You can sign up for Bespoke Institutional now and receive a 14-day trial to read today’s Triple Play Report. To sign up, choose either the monthly or annual checkout link below:
Bespoke Institutional – Monthly Payment Plan
Bespoke Institutional – Annual Payment Plan
Bespoke Investment Group, LLC believes all information contained in these reports to be accurate, but we do not guarantee its accuracy. None of the information in these reports or any opinions expressed constitutes a solicitation of the purchase or sale of any securities or commodities. This is not personalized advice. Investors should do their own research and/or work with an investment professional when making portfolio decisions. As always, past performance of any investment is not a guarantee of future results. Bespoke representatives or clients may have positions in securities discussed or mentioned in its published content.
Small Business Capex Divergences
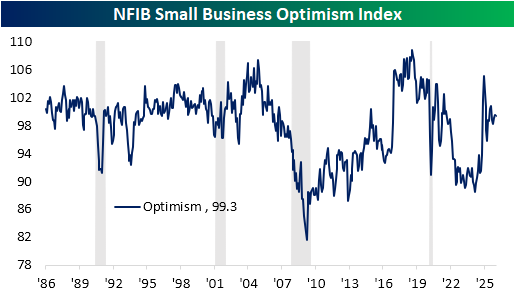
This morning, the National Federation of Independent Business (NFIB) published their monthly read on small business sentiment. As shown below, the headline index was pretty much uninteresting with a marginal drop of 0.2 points to 99.3. This index has now consistently been narrowing following the surge in response to the 2024 election, and the latest reading is not only in the middle of that post-election range, but also in the middle of the historical range, ranking in the 49th percentile.
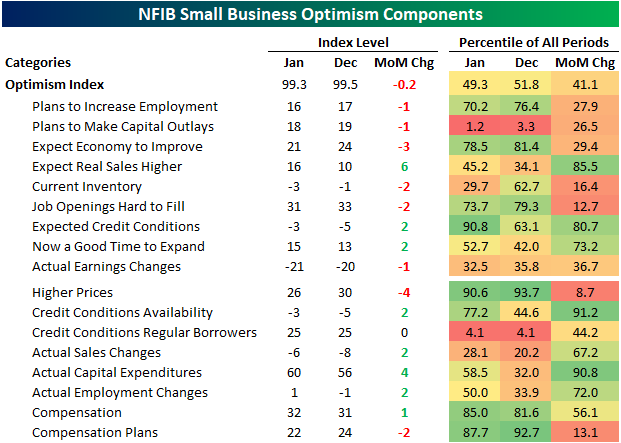
While the headline index isn’t jumping off the page, there have been some interesting details under the hood. The January drop in the index occurred on weak breadth as six of the nine inputs fell month over month. Non-inputs to the Optimism Index saw stronger breadth, with five of the eight indices rising.
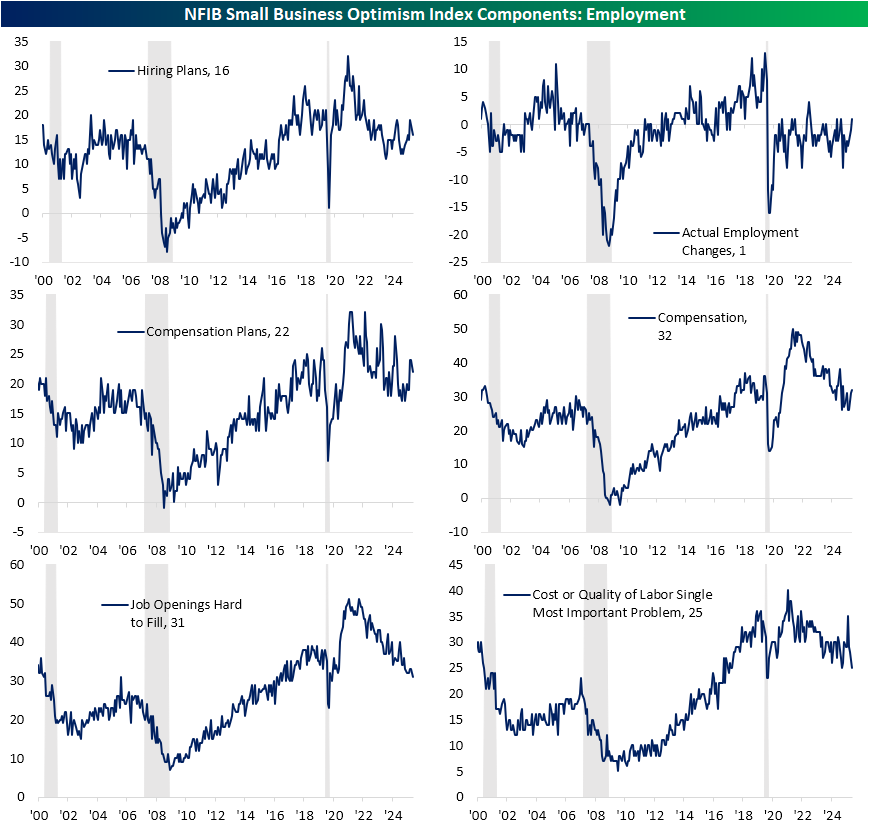
Among several topics we discussed in our Morning Lineup today, we noted how labor market indices included in the NFIB report have been trending in the right direction. In the charts below, we show a more granular look at each of the six relevant indices to this category. As shown, hiring and compensation plans did fall in January, but that was counteracted by observed upticks in actual employment and compensation. For actual employment changes, January saw a net positive reading (meaning firms saw net hiring during the month) for the first time since last April. Further, since 2020, positive readings have also been somewhat uncommon, only occurring 17.8% of the time.
While those readings were not at any sort of significant high, this month’s report saw the lowest share of respondents reporting jobs as hard to fill since July 2020. Additionally, labor was cited as the biggest single problem for only a quarter of firms, tying last May for the lowest share since May 2020.
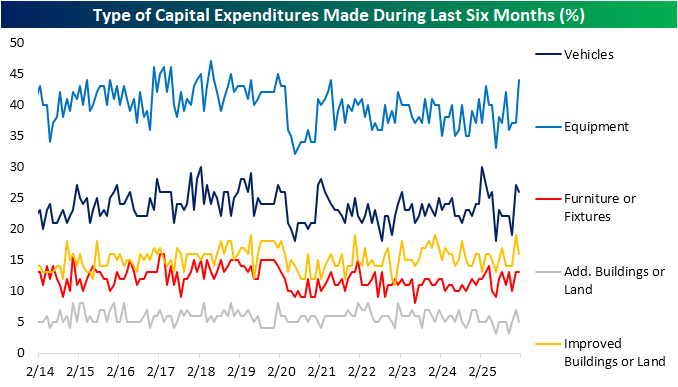
Looking to the other side of the production function, capex has seen an interesting divergence. Capex plans dropped to 18 for the joint lowest reading since 2010. Conversely, actual capital expenditures have risen sharply, hitting the high end of the past few years’ range.
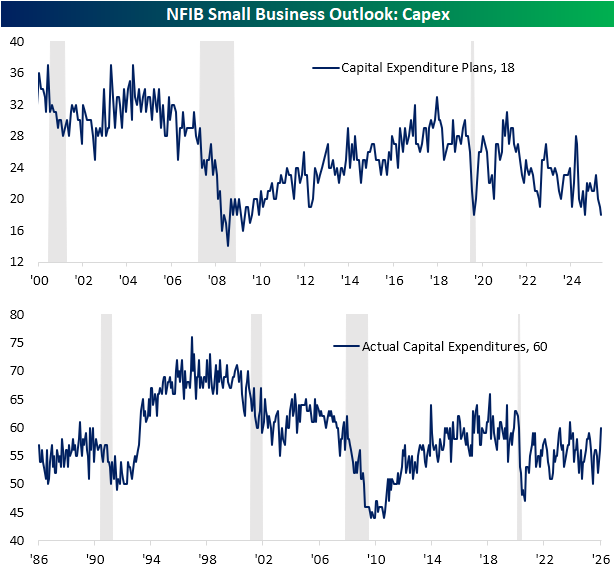
In the breakdown of spending, equipment seems to be the driving force of that capex spend. That category registered its strongest reading since May 2021, while vehicle spending has also remained elevated.
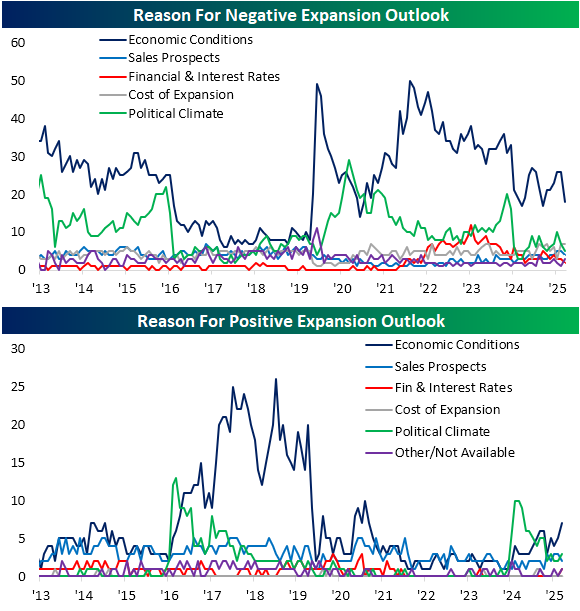
The share of firms viewing now as a good time to expand was middling versus history, as that index is in the 52nd percentile following a 2-point jump in the index to 15. As shown below, economic conditions are the predominant reason for both negative and positive expansion outlooks. While the former has seen that reason fall to the low end of its recent range, those pointing to the economy as a reason to expand hit the highest level in nearly five years.
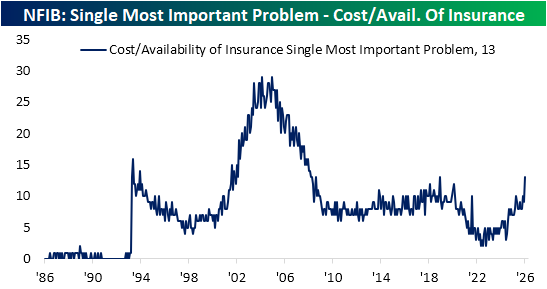
Finally, we would note that there was a 4-point drop in the index for higher prices, and the share of respondents reporting inflation as their biggest problem was unchanged at 12%. In other words, inflation did not appear to see any dramatic increase in importance. However, a related series showing the share of respondents reporting cost or availability as their biggest problem has surged up to 13%, tying December 2018 for the highest reading since August 2008.