ETF Trends: International – 4/5/16
Bespoke Stock Scores: 4/5/16
Bespoke’s Asset Class Performance Matrix: 4/5/16
Start a 14-day no obligation free trial to receive Bespoke’s paid content for the next two weeks.
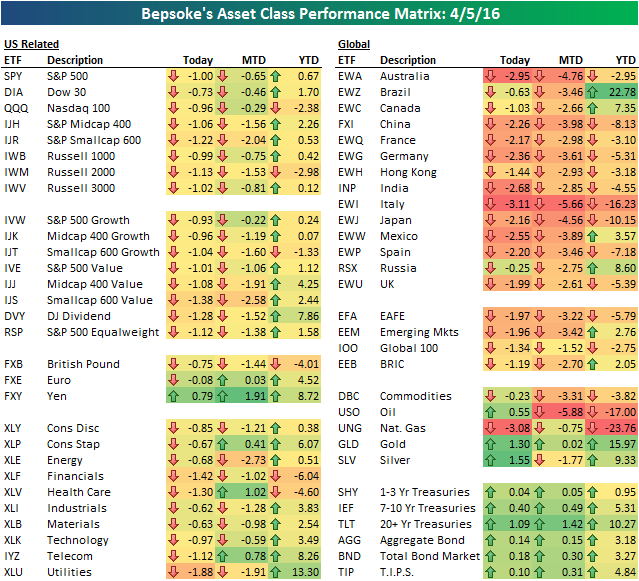
The S&P 500 (SPY) ETF fell 1% today as overbought levels continue to get worked off. The declines were led by Financials (down 1.42%), Health Care (down 1.30%), and Utilities (down 1.88%). Utilities usually rally when risk-free interest rates decline, but that didn’t happen today. Treasury ETFs rallied hard as the 10-year yield fell to 1.72%.
Outside of the U.S., equities fell even more, with most European country ETFs down more than 2%. The Italy ETF (EWI) was the worst performer in our matrix, while the Natural Gas ETF (UNG) wasn’t far behind (-3.08%). While nat gas was down, oil, gold, and silver managed to rally.
S&P 500 Remains Extended Even After Pullback
Start a 14-day no obligation free trial to receive Bespoke’s paid content for the next two weeks.
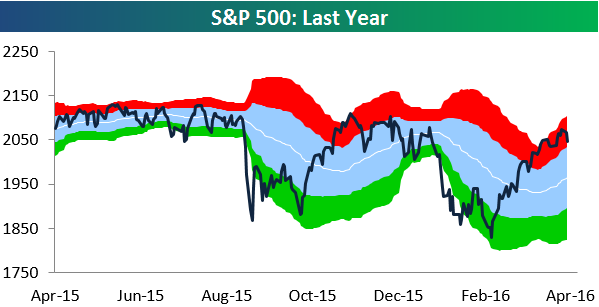
Below is a look at our trading range chart for the S&P 500 over the last year. The red zone represents what we call “overbought” territory, which is calculated as between one and two standard deviations above the index’s 50-day moving average. As shown, the index moved into overbought territory in March, and it has stayed there since. Even after the market’s pullback over the last few days, prices remain elevated. Overbought levels can be worked off in one of two ways: prices can decline back into neutral territory, or prices can trend sideways and allow neutral territory to catch up with it. Bulls will be hoping for the latter in the days ahead.
Market internals like the percentage of stocks above their 50-day moving averages in the S&P 500 remain elevated as well. As shown below, 88% of stocks in the index remain above their 50-days.
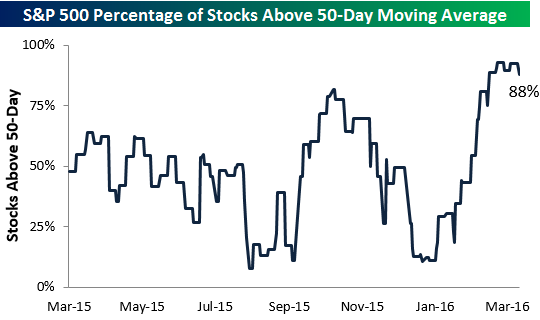
Chart of the Day – What are the ISM Commodities Surveys Telling Us About Inflation?
In today’s Chart of the Day, we look at the monthly surveys of commodities prices in the ISM reports and what they tell us about potential trends in inflation.
To read our Chart of the Day, enter your info below and start a free Bespoke research trial. During your trial, you’ll also receive access to our model stock portfolios, daily market alerts, and weekly Bespoke Report newsletter.
[thrive_leads id=’59052′]
Dow 30 Trading Range Screen
Start a 14-day no obligation free trial to receive Bespoke’s paid content for the next two weeks.
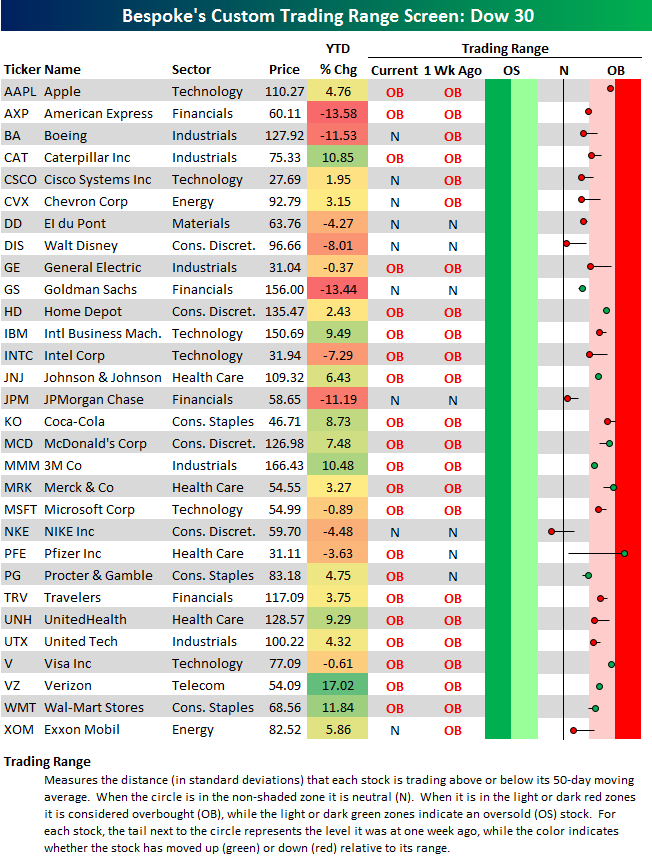
Below is an updated snapshot of our Dow 30 trading range screen. For each stock, the black vertical “N” line represents its 50-day moving average, the dot represents where it’s currently trading within its range, and the tail end represents where it was trading one week ago at this time.
Stocks have pulled back from extreme overbought levels over the last week, but as you can see in the screen below, 29 of 30 Dow stocks remain above their 50-day moving averages, and most remain at least slightly overbought. Pfizer (PFE) and Merck (MRK) — two large-cap Health Care names — are now the most overbought stocks in the index, while Nike (NKE) is the one stock below its 50-DMA. Three other stocks have moved down to generate an upcoming test of support at their 50-days — Disney (DIS), JPMorgan Chase (JPM), and Exxon Mobil (XOM). Let’s see if they can hold!
In terms of YTD performance, Verizon (VZ) is up the most at 17%, followed by Wal-Mart (WMT), Caterpillar (CAT), and 3M (MMM). Three financial stocks (AXP, GS, JPM) and Boeing (BA) have been the worst performers in the index so far this year.
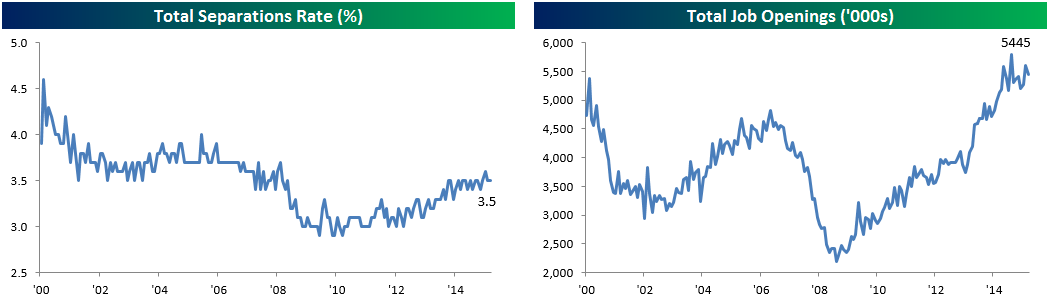
JOLTS Back In Business As February Sees Higher Quit Rates
After a disappointing reading last month, the Job Openings and Labor Turnover Survey (JOLTS) from the Bureau of Labor Statistics was somewhat improved in February. Headline job openings were down slightly but remained in their recent range while the separations rate (which includes all possible reasons for leaving a job including layoffs, firings, quits, retirements, and other forms of departure) was sideways MoM.
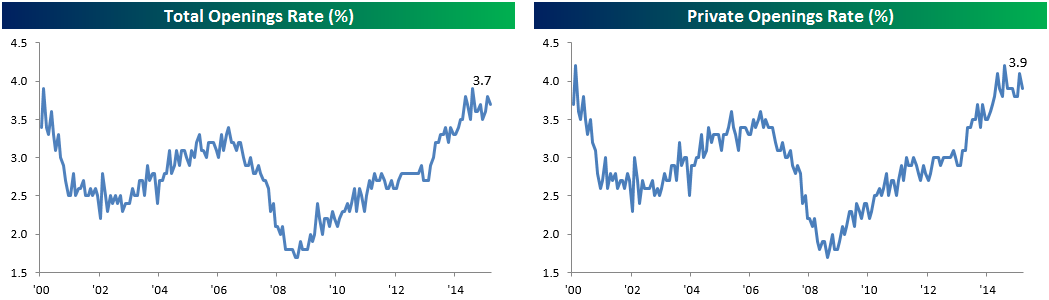
The total openings rate was lower sequentially, following headline openings numbers.
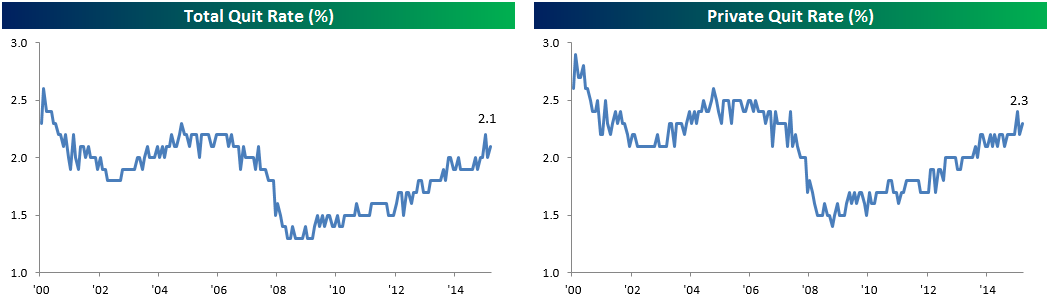
The more encouraging dynamic in the report was a modest recovery in quits. After falling off recovery highs in January, February data showed sequential improvement and quits are higher than they were during almost all of 2015 for both the private sector and total labor force.
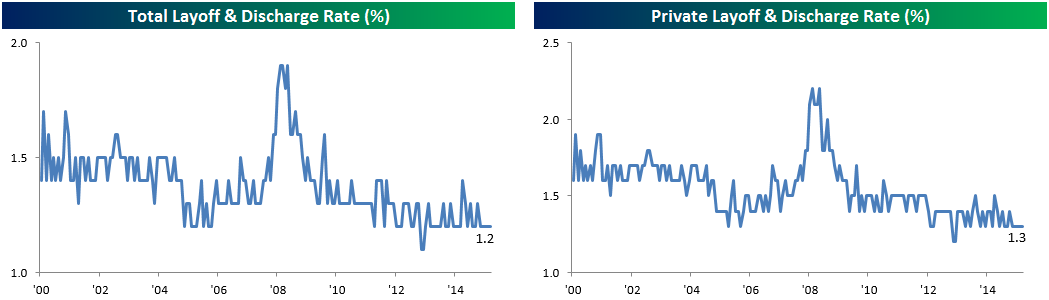
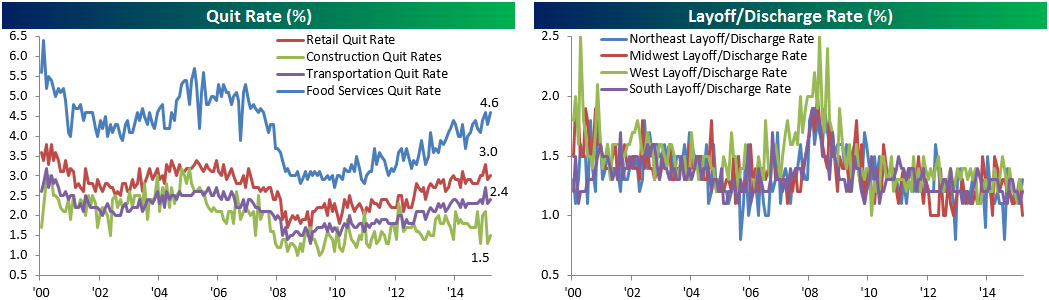
Layoff and discharge rates remain extremely low. Despite popular focus on headline numbers like those compiled in Challenger’s summary of job cuts, the statistically relevant sample of the American labor market in the JOLTS survey remained near recent lows in February at 1.2% of the total labor force and 1.3% of the private labor force; both of those figures are near the low end of the historical range.
Quit rates within industries also recovered somewhat. Low-prerequisite job categories like Food Services are dealing with their highest quit rates of the recovery while the trend higher in quit rates for Retail and Transportation appears to be intact. Construction quit rates have not recovered from their recent collapse. On a regional basis, layoffs plunged in the Midwest to their lowest-ever level while the Northeast saw a small uptick and West declined sequentially.
ISM Services Report Beats Expectations
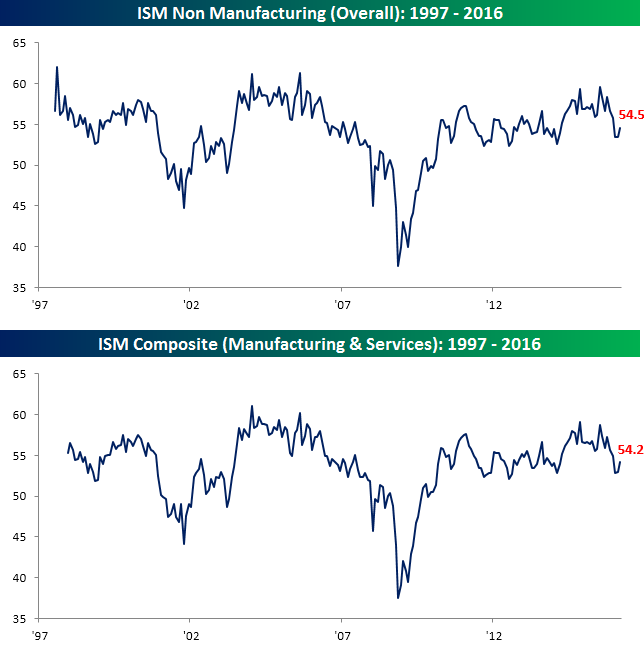
After last week’s report that showed stronger than expected growth in the manufacturing sector, today’s ISM report in the services sector also showed better than expected growth. While economists were expecting the ISM Non-Manufacturing survey to come in at a level of 54.2, the actual reading came in at 54.5. That’s still near the lows of the last two years, but it does break a streak of four straight monthly declines. On a combined basis and accounting for each sector’s share in the overall US economy, the ISM report for March came in at a level of 54.2, which is below levels seen as recently as January but is the highest reading for 2016.
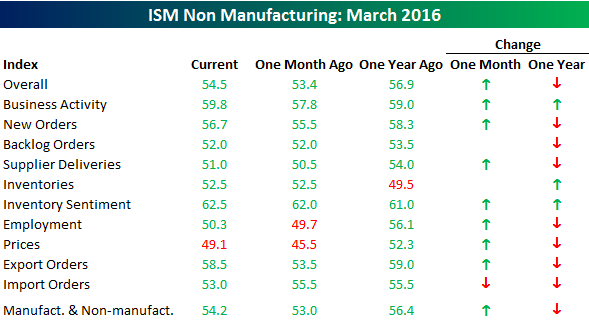
The table below breaks down this month’s report based on each component of the report. As shown, breadth was strong in March as the only category that showed a m/m decline was Imports. The biggest increases in March came in Export Orders (+5.0), Prices (+3.6), and Business Activity (+2.0). While the m/m figures were strong, though, relative to last year, the majority of categories are weaker with only three increases (Business Activity, Inventories, and Inventory Sentiment).
Dynamic Upgrades/Downgrades: 4/5/16
The Closer 4/4/16 – “Manufacturing Analogues”
Looking for deeper insight on global markets and economics? Tonight in The Closer we discuss the bullish analogue outlined below, as well as other analogues from the history of the US equity market. We also break down the Final version of Manufacturers’ Shipments, Orders, and Inventories report released by the US Census this morning.
The Closer also includes its standard charts, large volume and price movers in the US equity market, and Bespoke’s Market Timing Model. The Closer is one of our most popular reports, and you can sign up for a trial below to see it free for the next two weeks!
[thrive_leads id=’58717′]