Dynamic Upgrades/Downgrades: 4/7/16
The Closer 4/6/16 – “Doves Coo, EIA Stew”
Looking for deeper insight on global markets and economics? Tonight in The Closer we summarize and analyze the Fed minutes released this afternoon and break down weekly data from the Department of Energy on energy supply, demand, and inventories. We also preview a huge 24 hours in central banking with the heads of the BoJ, ECB, and Fed all taking the stage overnight and tomorrow.
The Closer also includes its standard charts, large volume and price movers in the US equity market, and Bespoke’s Market Timing Model. The Closer is one of our most popular reports, and you can sign up for a trial below to see it free for the next two weeks!
[thrive_leads id=’58717′]Bespoke’s Quarterly “Most Volatile Stocks on Earnings” Screen
Start a 14-day no obligation free trial to receive Bespoke’s paid content for the next two weeks.
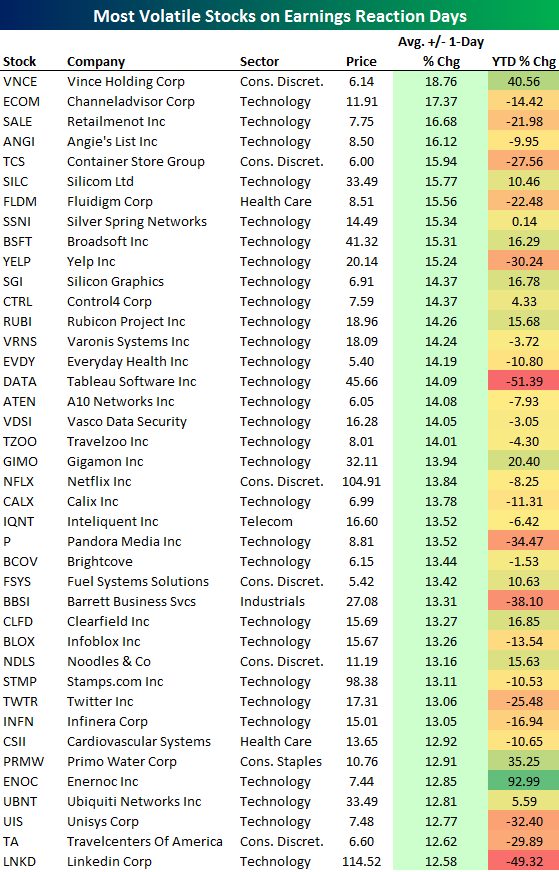
Prior to the start of each earnings season, we use our Interactive Earnings Report Database (available to Bespoke Institutional members) to highlight a list of the stocks that move the most on their earnings reaction days. (For stocks that report before the open, that trading day is its earnings reaction day. For stocks that report after the close, the next trading day is its earnings reaction day.)
To be included on the list, the stock has to trade over $5/share and have at least 10 quarterly earnings reports as a public company. For each stock in our earnings database, we’ve calculated its average absolute one-day change in reaction to its quarterly earnings reports over the last ten years. For example, if a stock moves up 10% on one earnings reaction day, and it moves down 20% on its next earnings reaction day, its average absolute one-day change on these two earnings reaction days is +/-15%.
Each stock listed below has historically averaged a move of +/-12.50% on its earnings reaction days over the last ten years. That’s a huge move to experience once per quarter! As shown, the most volatile stock on the list this quarter is Vince Holding (VNCE), which has historically moved +/-18.76% on earnings. ECOM, SALE, ANGI and TCS round out the top five with moves of more than +/-15.9%. Other notables on the list include Yelp (YELP), Silicon Graphics (SGI), Tableau Software (DATA), Pandora (P), Netflix (NFLX), Twitter (TWTR), and LinkedIn (LNKD). Netflix (NFLX) is the most volatile S&P 500 stock on earnings with an average change of +/-13.84%. Keep that in mind when NFLX reports on April 18th!
B.I.G. Tips – Earnings Season Stats from 70,000+ Quarterly Reports
Chart of the Day – Does Guidance Matter?
With earnings season right around the corner, we are beginning to hear a lot of earnings related commentary regarding the market. One such comment today was that the most important thing to watch during earnings season is guidance. With that in mind, in today’s Chart of the Day, we look at how guidance during earnings season compares to the market’s actual performance during the reporting period.
To read our Chart of the Day, enter your info below and start a free Bespoke research trial. During your trial, you’ll also receive access to our model stock portfolios, daily market alerts, and weekly Bespoke Report newsletter.
[thrive_leads id=’59052′]
ETF Trends: Fixed Income, Currencies, and Commodities – 4/6/16
Breaking Up?
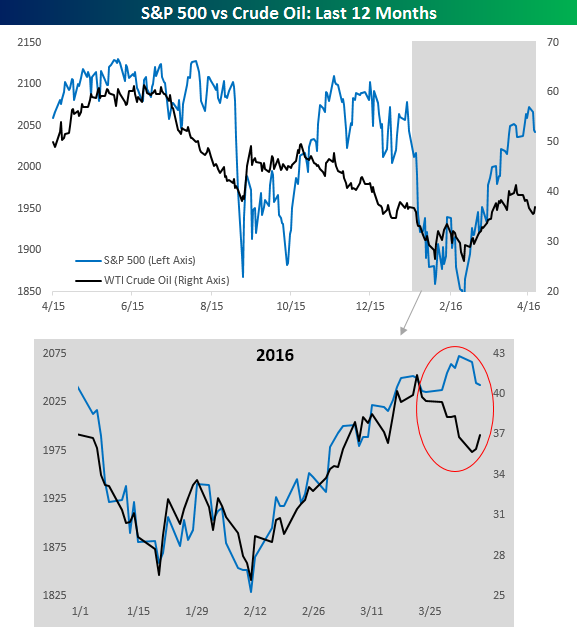
As goes oil so goes the stock market, right? The chart below shows the prices of the S&P 500 and crude oil over the last year with the YTD returns highlighted and enlarged. For 2016, the two had been moving in lockstep with each other, but over the last several days they have parted ways. When one trades up the other trades down and vice versa. While crude oil prices hit their most recent high in late March, equities kept rallying until 4/1. Now, over the last three days as equities have come under pressure, crude oil prices have rallied. In fact, if the S&P 500 finishes the day down (as it is in early trading) it will mark the sixth day in the last eight where the two had divergent daily returns. The last time they diverged that often over an eight-day period was back in July of 2015.
Dynamic Upgrades/Downgrades: 4/6/16
The Closer 4/5/16 – “Hedge Funds: Down But Not Out, Just Like The Quit Rate”
Looking for deeper insight on global markets and economics? Tonight in The Closer we analyze hedge fund performance. We also take a look in more detail at today’s JOLTS report, including our analysis of the current unemployment rate versus both openings and quits.
The Closer also includes its standard charts, large volume and price movers in the US equity market, and Bespoke’s Market Timing Model. The Closer is one of our most popular reports, and you can sign up for a trial below to see it free for the next two weeks!
[thrive_leads id=’58717′]