ETF Trends: Fixed Income, Currencies, and Commodities – 4/13/16
April Getting off to a Slow Start for Defensives
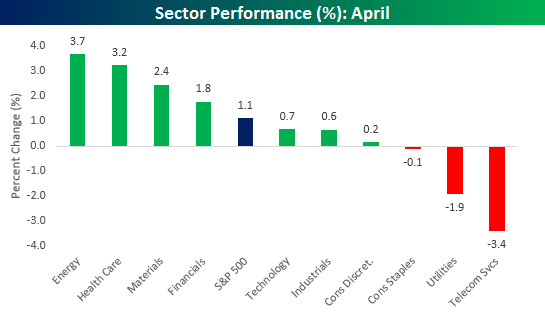
Granted, practically all of the gains came in Wednesday’s rally, but with a gain of 1.1%, April is shaping up to be a pretty good month for the S&P 500. The first chart below shows the performance of all ten sectors so far this month. The majority of sectors are all up month to date now, with Energy (3.7%), Health Care (3.2%), and Materials (2.4%) leading the way higher. Even Financials, which no one seemed to like heading into earnings season, are now outperforming the S&P 500 MTD. On the downside, what really stands out is the performance of the defensive sectors. Telecom Services (-3.4%), Utilities (-1.9%), and Consumer Staples (-0.1%) are all in the red for the month.
While defensives may be lagging this month, they are still outperforming the S&P 500 by a wide margin year to date. Below we show sector performance so far in 2016. Telecom Services and Utilities may be the two worst performing sectors this month, but with gains of 12.3% and 11.2%, respectively, they are still the top two performing sectors year to date. Behind these two sectors, the next three best-performing sectors are Energy, Materials, and Industrials. Last December, you would have had a hard time finding anyone who would have expected these three sectors to outperform along with Utilities and Telecom Services. On the other end of the spectrum, the two worst performing sectors this year are Financials (-3.9%) and Health Care (-2.9%)- two sectors that are actually outperforming on the month. So far in April, what was bad is good and what was good is bad.
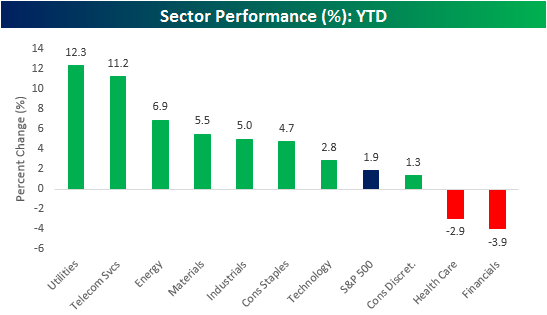
Chart of the Day: A Lost Generation of Individual Investors
When it comes to investing in the stock market, individual investors continue to have an apathetic (if not loathsome) view. We’ve written a lot about the negative impact that two 50%+ market declines within 10 years (2001/2002 and 2007-2009) of each other have had on long-term sentiment towards investing in stocks. Since the end of the financial crisis in 2009, our view has been that it’s going to take decades, not months or years, for individual investors to fully trust the market again. This view has certainly played out during the current bull market, because over the last seven years we have yet to see any individual investor sentiment readings turn excessively bullish. Many times in recent years, even as the market traded just a couple percentage points away from all-time highs, we’ve seen investor sentiment readings get nearly as bearish as they were at the lows of the financial crisis. That’s not supposed to happen. Historically, investor sentiment has turned extremely…
To continue reading our Chart of the Day, enter your info below and start a free Bespoke research trial. During your trial, you’ll also receive access to our model stock portfolios, daily market alerts, and weekly Bespoke Report newsletter.
[thrive_leads id=’59052′]
BRICs Market Update: Russian Stocks Still in Long-Term Downtrend After 45% Rally
The BRIC (Brazil, Russia, India, China) markets completely fell apart during the downturn in commodities and global manufacturing over the last two years. But 2016 has been a different story. The first few weeks of the year saw continued pain, but once lows were put in, equities in all four BRIC countries staged massive rallies.
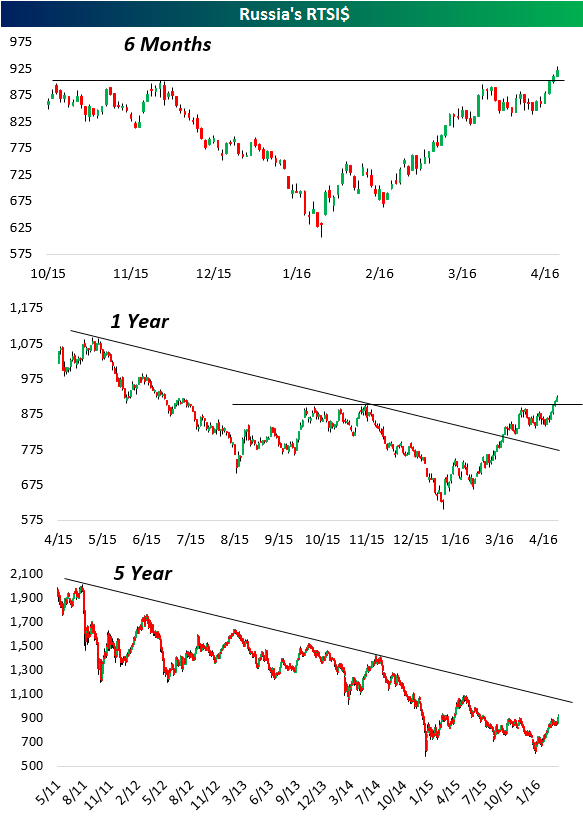
Below we take a look at short and long-term price charts for Russia’s Russian Trading System equity index in dollars. (Here are posts on China, Brazil, and India.)
From its low on January 20th, Russia’s stock market has gained 45%. Over the last few days, we’ve seen a solid breakout to 9-month highs.
Looking at the five-year chart, Russia’s stock market remains stuck in a long-term downtrend channel, but the short-term strength suggests to us that there is likely enough momentum for an eventual breakout from this downtrend.
Start a 14-day no obligation free trial to see Bespoke’s premium market content over the next two weeks.
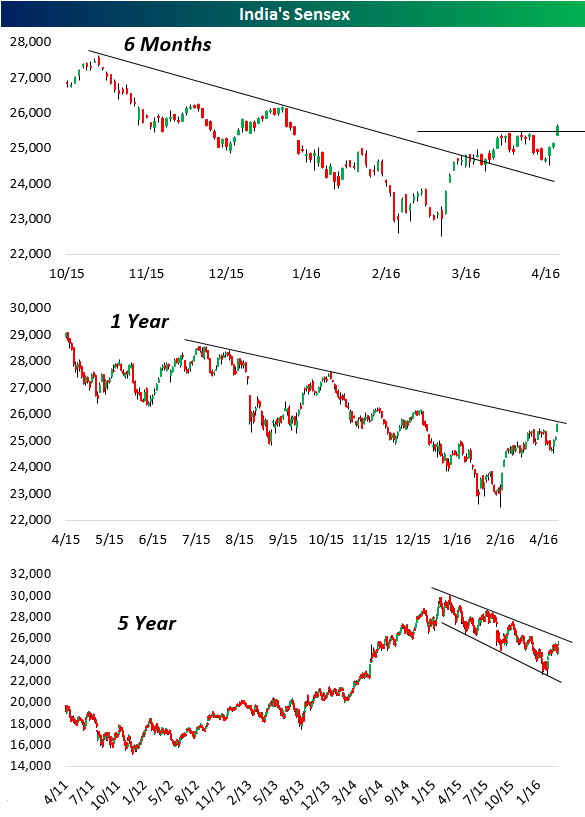
BRICs Market Update: India’s Sensex Short-Term Strength; Long-Term Challenge
The BRIC (Brazil, Russia, India, China) markets completely fell apart during the downturn in commodities and global manufacturing over the last two years. But 2016 has been a different story. The first few weeks of the year saw continued pain, but once lows were put in, equities in all four BRIC countries staged massive rallies.
Below we take a look at short and long-term price charts for India’s Sensex equity index in local currency. (Here are posts on China and Brazil. We’ll be concluding with a post on Russia.)
India’s stock market surged 40% in 2014, but it gave much of that back in 2015. After making a bear market low in February, we’ve seen a nice recovery and short-term downtrend break over the last few weeks. Today’s action has pushed the Sensex to new rally highs.
Looking at the five-year chart, the Sensex still hasn’t managed to break above its longer-term downtrend channel. We’ll need to see another 4-5% of gains for that to happen.
Start a 14-day no obligation free trial to see Bespoke’s premium market content over the next two weeks.
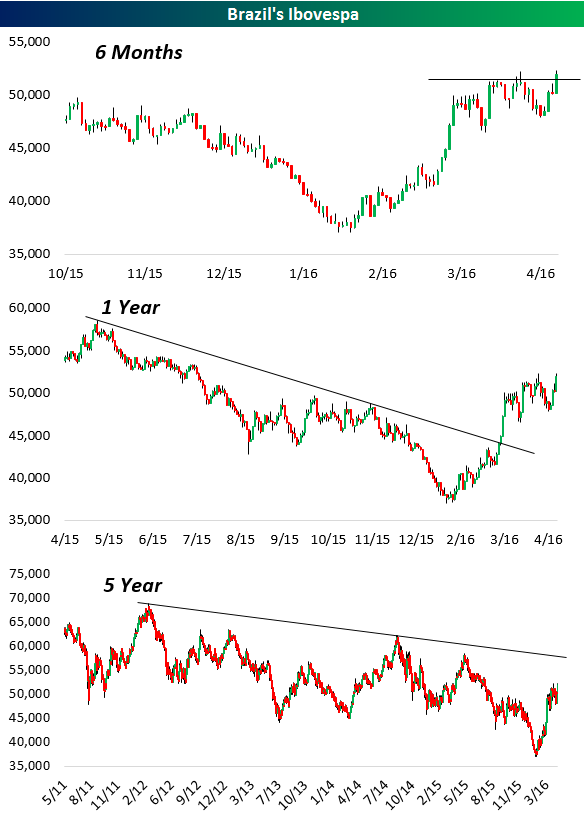
BRICs Market Update: Brazilian Stocks Explode Higher
The BRIC (Brazil, Russia, India, China) markets completely fell apart during the downturn in commodities and global manufacturing over the last two years. But 2016 has been a different story. The first few weeks of the year saw continued pain, but once lows were put in, equities in all four BRIC countries staged massive rallies.
Below we take a look at short and long-term price charts for Brazil’s Ibovespa equity index in local currency. (Here’s our prior post on China’s stock market. We’ll be doing additional posts on India and Russia as well.)
Back-to-back moves of 3% have now pushed Brazil’s main stock index up 45% from its lows earlier this year. You can see in the first chart below that gains over the last few days have caused a breakout to six-month highs.
The second chart shows a clear downtrend break over the one-year period, but the five year chart shows that Brazilian stocks still have a long, long road to recovery.
Start a 14-day no obligation free trial to see Bespoke’s premium market content over the next two weeks.
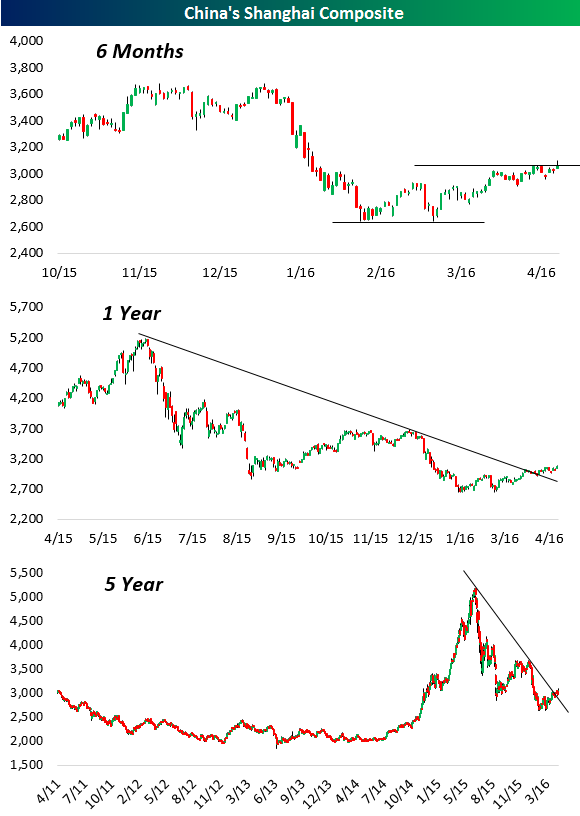
BRICs Market Update: China’s Shanghai Composite
The BRIC (Brazil, Russia, India, China) markets completely fell apart during the downturn in commodities and global manufacturing over the last two years. But 2016 has been a different story. The first few weeks of the year saw continued pain, but once lows were put in, equities in all four BRIC countries staged massive rallies.
Below we take a look at short and long-term price charts for China’s Shanghai Composite (in local currency). We’ll also be doing additional posts with the same charts for markets in Brazil, Russia and India.
The six-month chart for the Shanghai shows a double bottom put in back in February and March, and just today the index tried to make another leg higher above a consolidation phase that it has been in over the last couple of weeks.
The one-year chart shows that recent price action has pushed the index above the top of a downtrend channel that goes back to last June. The five-year chart shows the same downtrend break, but it puts into perspective just how extreme the moves have been for Chinese stocks over the last two years.
Start a 14-day no obligation free trial to see Bespoke’s premium market content over the next two weeks.
Bespoke CNBC Appearance (4/13)
Bespoke’s Paul Hickey appeared on CNBC’s Fast Money yesterday (4/12) to discuss the recent performance of the Energy sector and its prospects heading into earnings season. To check out the clip, click on the image below.

B.I.G. Tips – Retail Sales Weaker Than Expected
Retail sales for the month of March were released earlier this morning and came in weaker than expected across the board. On a headline basis, retail sales actually fell 0.3% compared to forecasts for a m/m gain of 0.1%. Most of this weakness was due to Autos, and after backing out that category, sales grew 0.2%, but that was still below the consensus expectation of 0.4%. Ex Autos and Gas, sales increased 0.1%, which was also weaker than the 0.3% estimate. While March’s numbers missed the mark, the weakness was somewhat offset by upward revisions to February’s numbers.
One notable aspect of this month’s report was the strength in Building Materials. While overall retail sales have been steadily trending lower on a y/y basis for several years now (blue line), the chart for Building Materials (red line) has been bucking the trend considerably. In fact, through March’s report, the gap between the y/y change between the two series was over nine percentage points. The only time the gap between the two has been wider was back in March and April of 2004.

In a B.I.G. Tips report just sent to Bespoke Premium and Bespoke Institutional members, we further break down the details of today’s report.
See the full B.I.G. Tips report by signing up for a monthly Bespoke Premium membership now. Click this link for a 10% discount ($89/month).
Crude Oil Inventories Rise Much More Than Expected
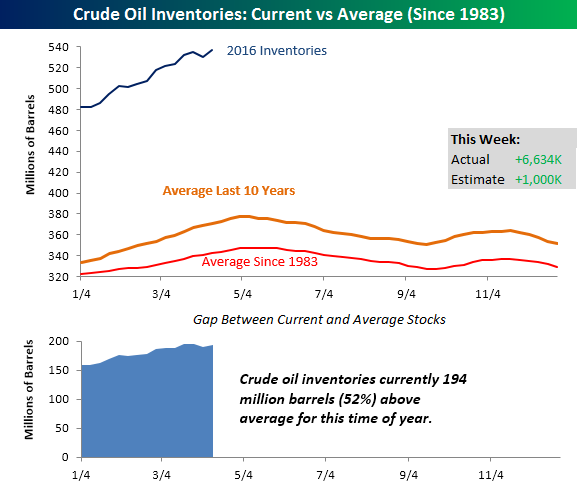
This week’s inventory report from the Department of Energy showed a much larger than expected build in crude oil inventories. While traders were expecting stockpiles to increase by 1 million barrels, the actual increase was nearly seven times that at 6.634 million. With this week’s build, US inventories are now back to multi-decade highs, and are currently 194 million barrels (52%) above their historical average for this time of year. Looking ahead, over the next few weeks we should start to see the seasonal build in inventory levels transition to drawdowns as we enter the summer season.
Start a 14-day no obligation free trial to see Bespoke’s premium market content over the next two weeks.