The Closer 4/14/16 – “FX & Yield, A Tale of TEUs, and CPI Soft”
Looking for deeper insight on global markets and economics? Tonight in The Closer we introduce a new model for short-term FX valuation. We also dive into valuation of the Bloomberg USD index, take a look at trade activity for West Coast ports, and finally analyze the most recent CPI data announced this morning by the BLS.
The Closer also includes its standard charts, large volume and price movers in the US equity market, and Bespoke’s Market Timing Model. The Closer is one of our most popular reports, and you can sign up for a trial below to see it free for the next two weeks!
[thrive_leads id=’58717′]Bespoke’s Sector Snapshot: 4/14/16
Chart of the Day – After-Tax Returns
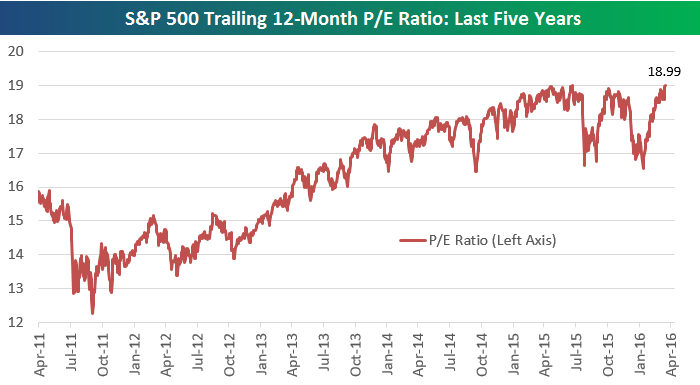
S&P 500 Trailing 12-Month P/E Ratio Hits Six-Year High
While the S&P 500 hasn’t quite taken out its May 2015 all-time high (it needs about 2% more of gains), the index’s trailing 12-month P/E ratio is set to make a new six-year high if market gains hold today. Below is a chart showing this valuation metric over the last five years:
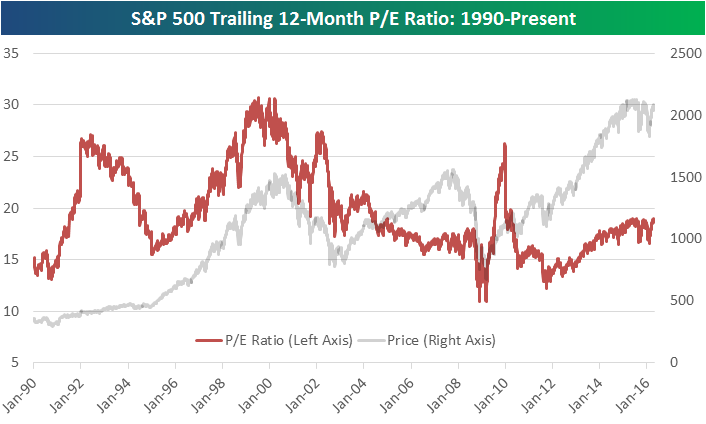
If you’re looking for a longer-term perspective of the S&P’s trailing P/E, below is a chart going back 20 years:
ETF Trends: US Indices & Styles – 4/14/16
the Bespoke 50 — 4/14/16
Dynamic Upgrades/Downgrades: 4/14/16
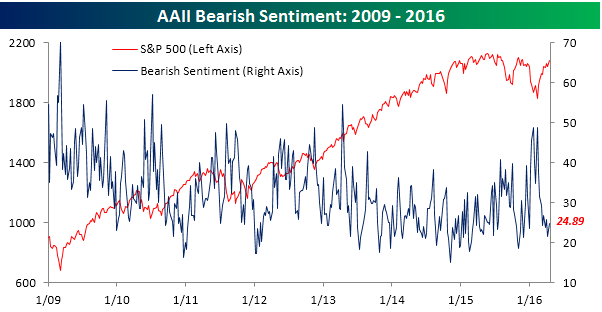
Bullish Sentiment Declines
Did individual investors not get the memo that the S&P 500 is up 2% in the last week? Normally, when stock prices rise, investor sentiment follows suit. However, in this week’s survey of investor sentiment from AAII, bullish sentiment actually declined from 32.19% down to 27.85%. That now makes it 24 straight weeks where bullish sentiment has been below 40%. Furthermore, in the last 59 weeks, there has only been one week where bullish sentiment went above 40%. At these levels, it’s quite the reach to call sentiment overly optimistic.
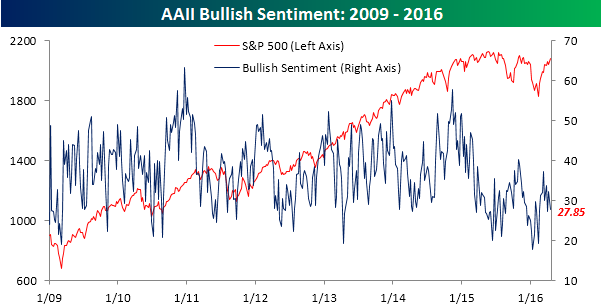
Most of the decline in bullish sentiment this week went straight through to the bearish camp (as opposed to just “neutral”). As shown in the chart below, bears increased from 21.46% up to 24.89%.
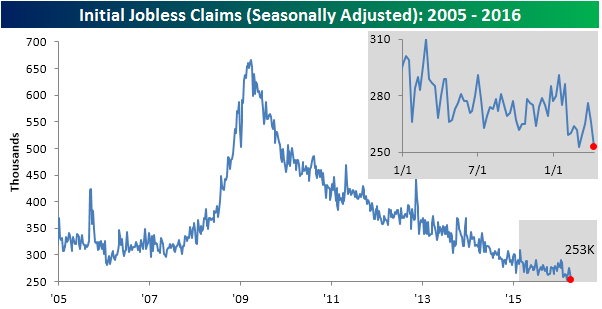
Jobless Claims Back Down to 1973 Levels
Remember earlier this year back when jobless claims got as high as 291K and there were worries that it was a signal of imminent recession? Well, neither do jobless claims. In this week’s latest update, initial claims fell by 13K down to 253K from 266K last week. This level is tied for the lowest weekly reading since 1973 and represents the 58th straight week where weekly claims were below 300K. As shown in the chart below, if this keeps up we are going to have to adjust our y-axis to the downside, and under those circumstances, it is hard to make the argument that there’s weakness in the economy.
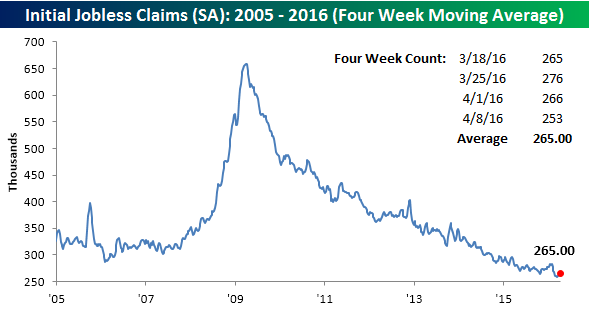
With this week’s drop in the weekly reading, the four-week moving average also declined, but because we were already peeling off a 259K reading from the count, the magnitude of the decline was small (266.5K down to 265K).
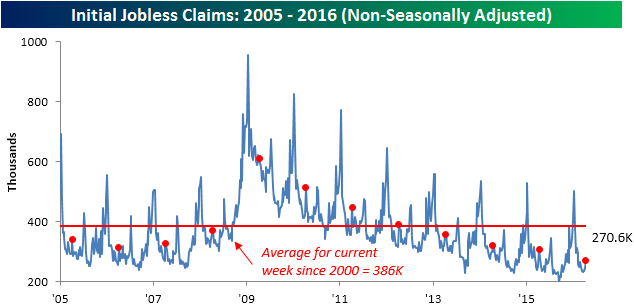
Non-seasonally adjusted (NSA) claims actually increased this week, rising from 245K up to 270.6K, but as the chart illustrates, it is common for NSA claims to rise in early April. In fact, for the current week of the year NSA claims are more than 100K below the average since 2000, and the last time they were lower at this time of year was in 1973 (just like the seasonally adjusted number).
The Closer 4/13/16 – “Easter Bunny Bounces Retail Sales, EIA Review, State Level FX”
Looking for deeper insight on global markets and economics? Tonight in The Closer we dig in to retail sales data and tease out some interesting seasonal adjustment issues. We also take a look at revisions to January and February reports. EIA charts on oil production, inventories, gasoline consumption, and gasoline inventories are updated, and we spend some time looking at state-level foreign exchange valuation. That includes an analysis of sensitivity of employment to the FX rates face by states versus their trading partners.
The Closer also includes its standard charts, large volume and price movers in the US equity market, and Bespoke’s Market Timing Model. The Closer is one of our most popular reports, and you can sign up for a trial below to see it free for the next two weeks!
[thrive_leads id=’58717′]