the Bespoke 50 — 4/21/16
The Latest Chinese Financial Market Excitement: Steel Rebar Futures
Start a 14-day no obligation free trial to sample Bespoke’s premium research.
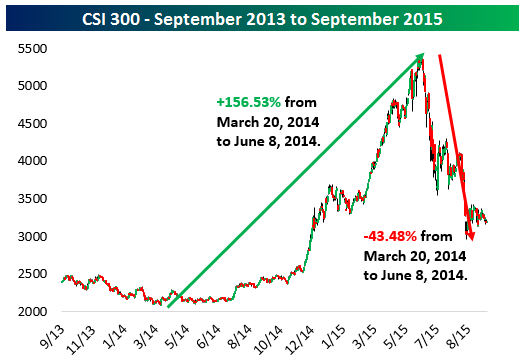
Over the last several years, Chinese financial markets have gotten enormous attention as their arcane, foreign, and ultimately opaque drivers start to impact global markets. This isn’t just a Chinese economics story. Rather, it’s about how frequently we see headlines, reports, analyses and general focus on rapid appreciation of financial products. Some are easy to understand: real estate or equities. Others are less transparent: copper-backed collateralized lending or wealth management products. Below we chart the 2014-15 stock market surge that was inevitably unwound and suffered the greatest pain in the lead up to China’s surprise currency depreciation last year.
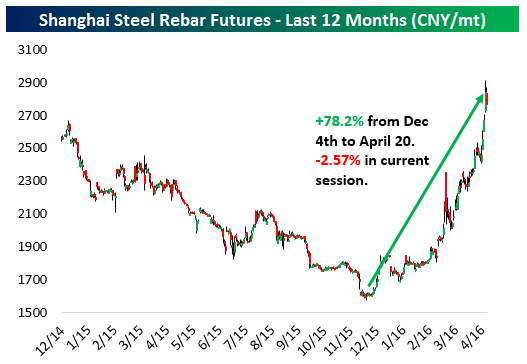
The most recent fad appears to be, of all things, steel rebar futures. Shanghai-traded rebar futures (priced in Chinese yuan) have exploded higher in price since December. Part of this price action has been technical; rebar futures had been declining in an almost straight line since 2011 and were trading similar to iron ore or copper. Both of those have also gained of course; iron ore futures traded in Dalian are up 76.6% since their low on the 10th of December last year. Spot iron ore bottomed 4 days later. COMEX copper bottomed in mid-January. But it’s Chinese local products (hot rolled steel also bottomed on the 4th of December) that have really led the charge. The drivers are complex, as technicals (the extreme oversold conditions) and the likelihood of a wave of government stimulus in China have ramped up.
With the outperformance from miners so far this year on the back of strong metals prices (Stoxx 600 Basic Resources +25% YTD; S&P 500 Mining & Metals +41.1% YTD; MSCI Global Metals & Mining +38.65% YTD), it’s worth keeping in mind that much of the rally in underlying commodities started in China. A weaker US dollar, higher oil prices, and extreme sentiment readings have also supported prices, of course, and may continue to do so going forward. But if Chinese stimulus – and speculative! – hopes don’t pan out, there’s plenty of room for collateral damage outside the country.
Jobless Claims Make New Low
Initial jobless claims fell again this week after a strong showing last week. On a seasonally adjusted basis, claims are now below 250,000, a level that was last achieved in 1973. Back then, however, the labor force was much, much smaller. In February 1973, 0.292% (29.2 bps) of employed persons filed jobless claims. Incredibly, that number is more like 0.168% (16.8 bps) of employed persons today. That is, it goes without saying, an all-time low dating to the late 1960s when data for initial jobless claims begins. During the 1990s expansion, the low was 0.206% (20.6 bps), while the 2000s had a 0.214% (21.4 bps) low. Below we chart initial jobless claims over the last 10 years.

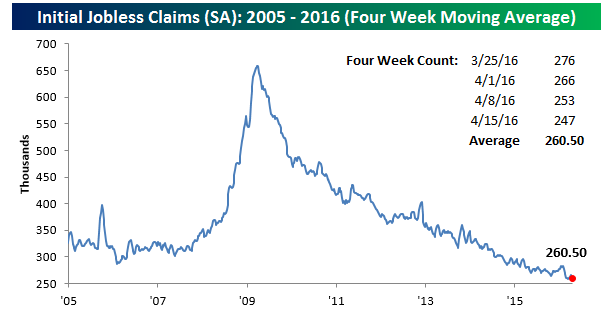
Below we show initial jobless claims on a four-week moving average basis. Today’s print takes the average down to 260.5k; while that is not a new post-recession low, it’s well below the prior expansion range and it should make a new low next week as a high 276k print rolls off.
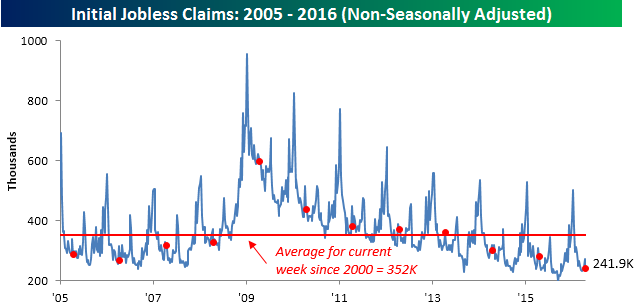
Finally, this was also a very strong week for non-seasonally adjusted initial claims, with that data point coming in 81k below the average since 2000 for this week of the year. It’s made a new low for that period and is down versus a year ago.
ETF Trends: Fixed Income, Currencies, and Commodities – 4/20/16
Pulse Points – NFLX: Sizing up the Competition
Today we have published a new Pulse Points report as part of our Consumer Pulse add-on package looking at the competitive dynamics of Netflix in the streaming media space. Are competitors like Amazon Prime and HBO Now making inroads? Find out by signing up for a 30-day free Consumer Pulse add-on trial today.