Best and Worst Performing Stocks on Earnings
Start a 14-day no obligation free trial to sample Bespoke’s premium research. Our Bespoke Report newsletter sent to paid members every Friday is a great read if you’re looking for weekend reading.
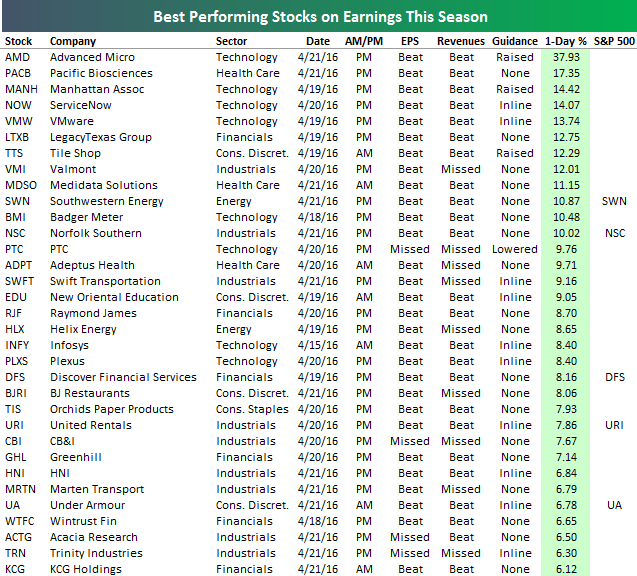
Just over 300 companies have reported first-quarter numbers so far this earnings season. The average stock that has reported this season has gained 0.10% on its earnings reaction day (first trading day following earnings), but 45 stocks have gained more than 5%. Below is a list of this season’s biggest winners. Advanced Micro (AMD) ranks first with a one-day gain of nearly 38% in response to earnings. That’s nearly double the 17.35% that Pacific Biosciences (PACB) — the second biggest winner — gained. Other notables on the list of winners include Southwestern Energy (SWN), Norfolk Southern (NSC), United Rentals (URI) and Under Armour (UA).
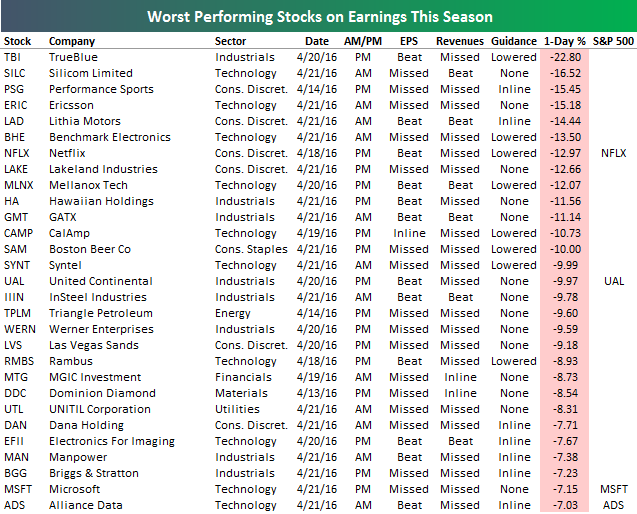
While 45 stocks have gained more than 5% on earnings, 48 have fallen more than 5%. Below is a list of the stocks that have fallen the most (more than 7%). As shown, TrueBlue (TBI) has been the biggest loser with a one-day drop of 22.8%. Netflix (NFLX) has been the biggest loser in the S&P 500 with a drop of 12.97%. Other notables on the list of losers include United Continental (UAL), Las Vegas Sands (LVS), Manpower (MAN), and Microsoft (MSFT).
Start a 14-day no obligation free trial to sample Bespoke’s premium research.
ETF Trends: Hedge – 4/22/16
Bespoke’s Weekly Chart Book – 4/22/16
Chart of the Day: Early Earnings Season Read
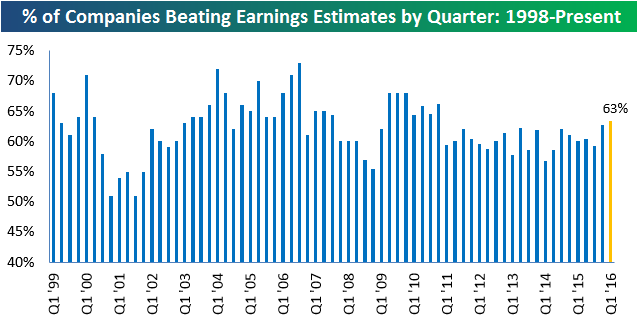
So far this earnings season, 309 companies have reported their Q1 numbers. While that’s just 20% or so of the total amount that will report this season, it’s enough to get an early read on how the numbers are coming in. Of the 309 companies that have reported thus far, 63% have beaten consensus analyst earnings estimates. Below is a chart showing the historical quarterly earnings beat rate going back to 1999. As you can see, a 63% beat rate for this season would be slightly stronger than last season’s beat rate, which itself was the strongest reading post since 2010. In today’s Bespoke Chart of the Day, we take a look at a few more early earnings season reads that are of interest to investors. Access to today’s Chart of the Day is included with each of our membership levels shown below. Click here if you would like to take a quick look at what you get with each membership level.
Newsletter Annual – $316/yr (20% off)
Newsletter Monthly – $39/mo (20% off)
Premium Annual – $795/yr (20% off)
Premium Monthly – $79/mo (20% off)
Institutional Annual – $1595/yr (20% off)
Institutional Monthly – $155/mo (20% off)
Bespoke Consumer Pulse Composite Sentiment Indices: April 2016
You do not currently have access to this report. Purchase a Pulse add-on subscription here.
ETF Trends: US Indices & Styles – 4/21/16
Chart of the Day: Alphabet (GOOGL) Down After Hours
Like a lot of other stocks that reported since the closing bell, shares of Alphabet (GOOGL) are down sharply after hours. For GOOGL, a negative reaction to earnings is relatively uncommon for the stock, so in today’s Chart of the Day we took a look at how the stock has historically performed from the open to close following a negative gap in reaction to earnings. Access to today’s Chart of the Day, is included with each of our membership levels below. Click here for a quick look at what you get with each membership level.
Newsletter Annual – $316/yr (20% off)
Newsletter Monthly – $39/mo (20% off)
Premium Annual – $795/yr (20% off)
Premium Monthly – $79/mo (20% off)
Institutional Annual – $1595/yr (20% off)
Institutional Monthly – $155/mo (20% off)
Bespoke’s Sector Snapshot — 4/21/16
S&P 500 Sector Weightings — Historical and Current
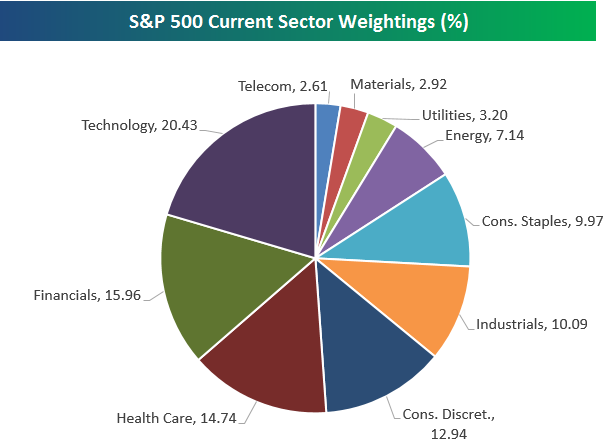
Below is an updated snapshot of S&P 500 sector weightings. As shown below, the Technology sector makes up the largest piece of the pie at just over 1/5th of the index. Financials ranks second with a weighting of 15.96%, followed by Health Care at 14.74%. After Health Care comes Consumer Discretionary at 12.94%, then Industrials at 10.09%, and Consumer Staples at 9.97%. The Energy sector is the 7th largest (or 4th smallest) of the ten with a weighting of 7.14%. That’s actually up from readings in the mid-6s at the start of 2016. The three smallest sectors are Utilities, Materials, and Telecom. When combined, these three sectors aren’t even as large as the Consumer Staples sector.
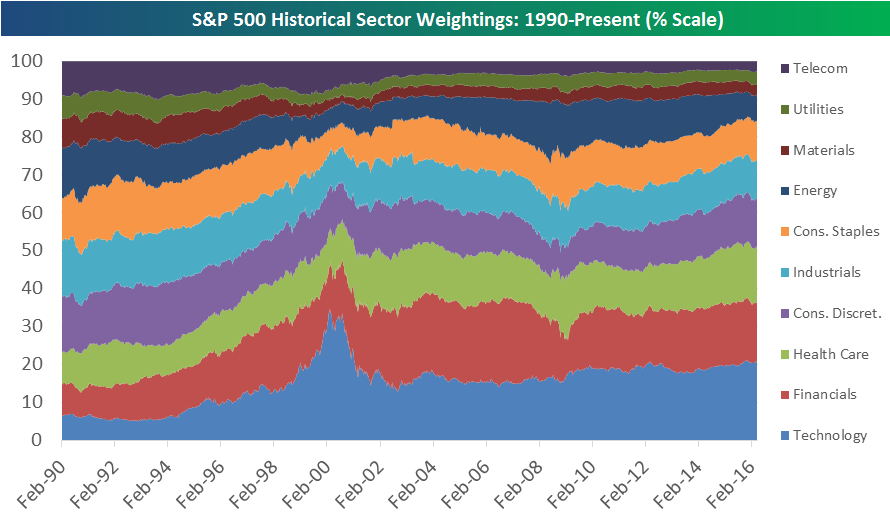
Below is a chart that shows historical trends in sector weightings going back to 1990. Back then, Technology was actually one of the smallest sectors, while Industrials, Consumer Discretionary, and Energy were the largest. But there was much more balance within the index back then. No sector made up more than 15% of the index, and no sector had a weighting of less than 6%. Today, the three largest sectors of the index have a combined weighting of 51%, while the three smallest sectors combine for just 8.7%. You can see that things really got out of whack during the Dot Com boom when Tech skyrocketed to a weighting of more than 30%. After the Tech bubble burst, Financials began to grow and grow and grow until it got as high as 22.5%. Since the Financial Crisis, Technology has regained its lead as the largest sector of the market.
Another thing that the chart below highlights is the dramatic shift that the US economy has experienced away from manufacturing and into services.
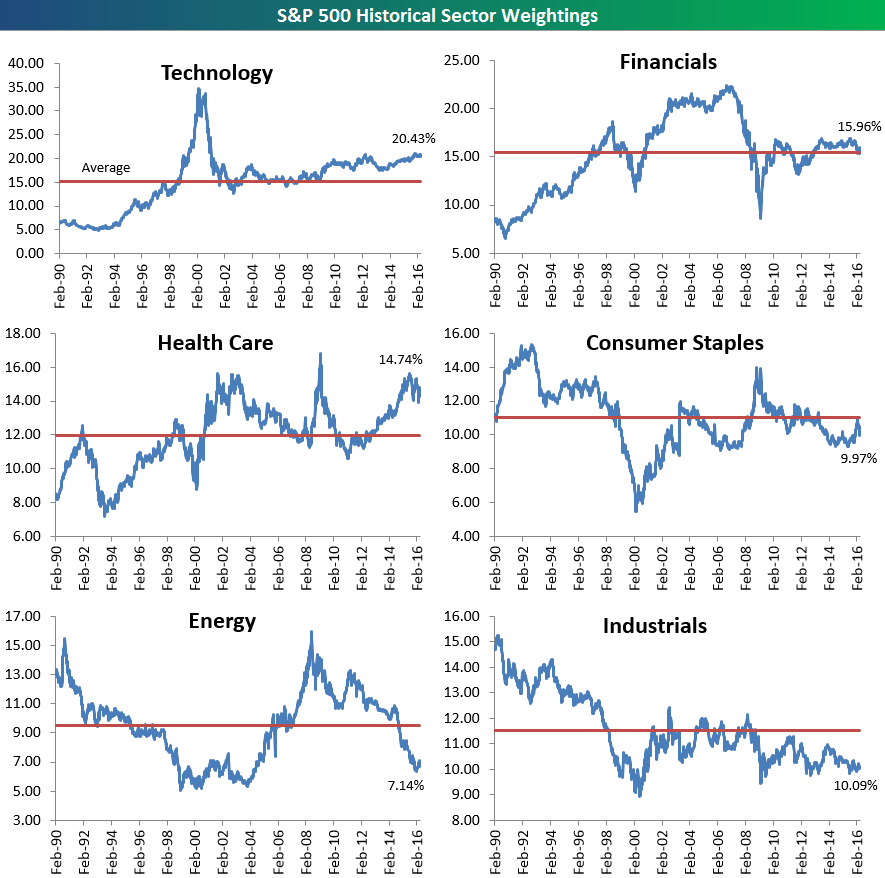
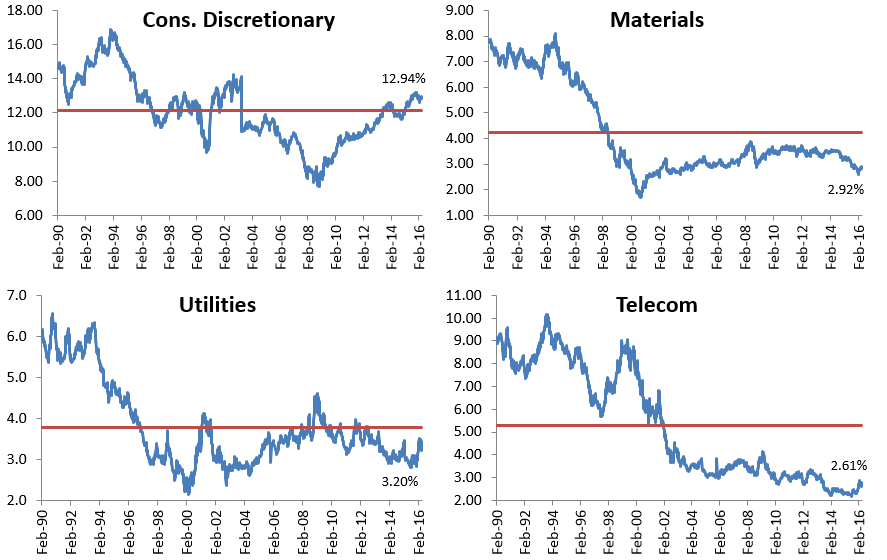
Below we provide historical S&P 500 weighting charts for each sector going back to 1990. The red line represents each sector’s average reading over the entire time period, so you can see which sectors are currently above or below their long-term averages. Technology, Health Care, and Consumer Discretionary are the three sectors with readings above their long-term averages, while Energy, Industrials, Materials, Utilities and Telecom are all below. Financials and Consumer Staples are currently trading pretty much right in-line with their historical averages.
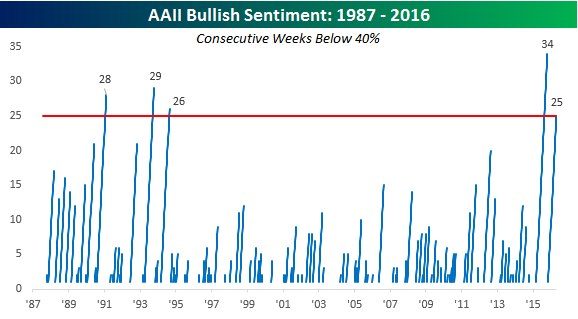
Bullish Sentiment Rebounds; Still Below 40%
Investor sentiment for the latest week was released earlier today, and according to AAII, bullish sentiment increased from 27.9% up to 33.4%. After a huge rally off the February lows that has taken the S&P 500 back within a couple of percentage points from its all-time high, the best we can do is a third of investors in the bullish camp?

The subdued level of enthusiasm on the part of investors is a trend that has been in place for well over a year now, and one we have thoroughly documented. In fact, this week’s 33.4% reading in bullish sentiment represents the 25th straight week where bullish sentiment was below 40%, and outside of one week in late October, bullish sentiment has been below 40% for 59 of the last 60 weeks. The chart below shows historical streaks where AAII bullish sentiment was below 40%. As shown, the current run of 25 weeks is only the fifth streak that has lasted 25 weeks or longer going back to 1987. Furthermore, the current streak was preceded by a streak of 34 weeks below 40%, and that was the longest in the history of the survey.
Last week we published a Chart of the Day for paid subscribers titled “A Lost Generation of Investors” that has additional thoughts on depressed stock market sentiment. You can view it here for free. If you’d like to see more of our paid work, you can start a 14-day no obligation free trial here.