Chart of the Day: Apple 8-Day Losing Streak; Longest Since 1998
It’s been a rough couple of weeks for Apple (AAPL) and its shareholders. As shown in our trading range chart of the stock below, AAPL is now trading in extreme oversold territory at more than two standard deviations below its 50-day moving average (bottom of green shading). As recently as three weeks ago, the stock was trying to break above it’s 10-month downtrend channel and was actually at extreme overbought levels. That shows just how quickly sentiment has soured for the largest company in the world.

Things have gotten so bad recently that the stock can’t even manage one up day. If the stock closes lower today, it will mark its 8th consecutive down day. That hasn’t happened since 1998!
Continue reading today’s Chart of the Day on Apple (AAPL) by starting a 14-day no-obligation free trial to our paid research platform.
Bespoke Stock Seasonality: 5/2/16
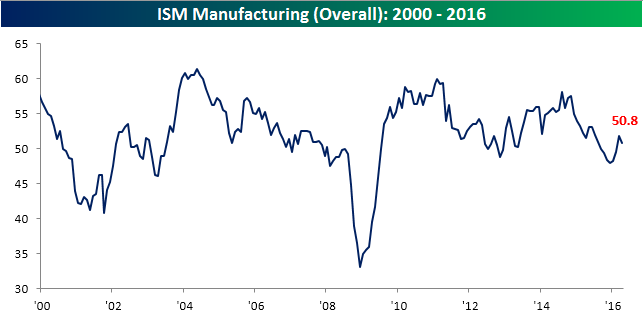
ISM Manufacturing Declines More than Expected
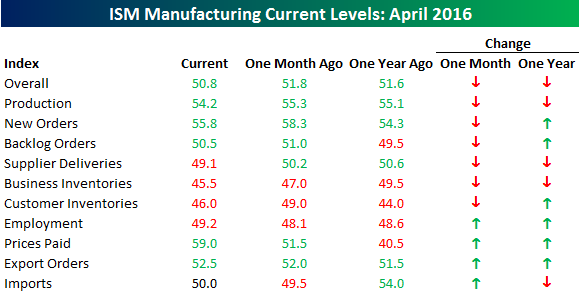
After last month’s surprising strength in the ISM Manufacturing survey, the April report showed a larger than expected decline. Heading into the report, economists were expecting the headline reading to come in at a level of 51.4 from last month’s reading of 51.8, but the actual reading showed a decline down to 50.8. In spite of the disappointment, though, the Manufacturing sector is still exhibiting overall growth, which is more than we could say for the five months prior to March.
The table below summarizes the individual subsectors of April’s ISM Manufacturing report, showing their m/m and y/y changes. Like the headline index, six of the ten subcomponents declined in April with Customer Inventories and New Orders showing the largest declines, although in the case of New Orders, the index is still at 55.8 which is indicative of solid growth. On the upside, the two notable sectors were Prices Paid and Employment. Prices Paid increased 7.5 points to 59.0 — the highest level since September 2014. On a related note, respondents to this month’s survey also noted price increases in 19 different commodities, which was the highest reading since May 2014. With regards to Employment, that component is still under 50 but did reach its best level since November. Finally, on a y/y basis, the breadth of April’s report was somewhat better with six components increasing and just four declining.
Dynamic Upgrades/Downgrades: 5/2/16
Bespoke Brunch Reads: 5/1/16
Welcome to Bespoke Brunch Reads — a linkfest of the favorite things we read over the past week. The links are mostly market related, but there are some other interesting subjects covered as well. We hope you enjoy the food for thought as a supplement to the research we provide you during the week.
Health Frontiers
Apple’s First CareKit Apps Are Here (Fast Company)
There are high hopes amongst the developer and medical communities that the plethora of data collected by the company’s devices and collated via their CareKit API will yield new and innovative approaches to health apps. [Link]
If cryonics suddenly worked, we’d need to face the fallout by Rachel Nuwer (BBC)
What if tomorrow you could go to sleep and wake up in a hundred years, ready to be cured of impending disease? The ethics of this question are more complex than they might appears. [Link]
Sports
The Braves Play Taxpayers Better Than They Play Baseball by Ira Boudway and Kate Smith (Bloomberg)
For those familiar with John Malone’s Liberty complex of businesses, it should come as no surprise that the Atlanta Braves (owned in part by that complex) are masters at tax code manipulation. [Link]
Retail & E-Commerce
‘Free’ Shipping Crowds Out Small Retailers by Laura Stevens (WSJ)
While free shipping may not be impossible for small businesses, it’s certainly a barrier to entry that offers increasing economies of scale to the giants of e-commerce. [Link, paywall]
Buyouts Saddle Stressed Retailers With Debts They Can’t Pay by Lauren Coleman-Lochner and Lindsey Rupp (Bloomberg)
In a “business 101” lesson, a good investigation of how high debt loads aren’t always smart or sustainable, regardless of why they are taken on. [Link]
Department Stores Need to Cull Hundreds of Sites, Study Says by Suzanne Kapner (WSJ)
Retailers have expanded their physical footprints but shrunk their sales since the middle of the last decade; as a result, to reach the same levels of productivity they would need to close hundreds of “anchor” stores that support local malls. [Link , paywall]
Investing
End of Golden Era for Investors Spells Troubles for Millennials by Rich Miller (Bloomberg)
Lower returns mean that younger investors need a higher savings rate in order to reach retirement goals; in a recent study, McKinsey quantified some of the implications. [Link]
Artko Capital LP 1Q 2016 Investor Letter by Peter Rabover (Artko Capital)
A look inside the portfolio of Artko, a small value-focused equity hedge fund. We enjoyed the process Rabover lays out just as much if not more than seeing the positions themselves. [Link]
Opinion: What investors can learn from how investors read the news by Jeremy Olshan (MarketWatch)
A summary of what can be devined from where the clicks go during the course of the trading day. [Link]
Media Matters
What’s Really Killing Digital Media: The Tyranny Of The Impression by Max Willens (Newsweek)
Incentives matter, and the current incentives provided to digital media almost guarantee a race-to-the-bottom for the fastest and largest number of brief views on pages. But a group of industry leaders are trying to shift that model from a binary one (impressions) to one with more flexibility (time). [Link]
Swoosh
Nike founder Phil Knight worries that nation is losing its entrepreneurial edge by Susan Page (USA Today)
Sports apparel legend Knight is worried that pessimism is holding back entrepreneurs and the economy as a whole. [Link]
Long Term Thinking
No One Believes It, but Inflation Is a Pretty Good Bet by Ken Brown (WSJ)
Markets continue to price extremely low risk premiums which could prove painful if inflation rises by only a small amount. [Link, paywall]
Guest post: Toby Nangle on the end of the “Goldilocks slump” by Toby Nangle (FT Alphaville)
A sweeping analysis of three possible futures designed by the holy trinity, of which the economy must pick two: high corporate profits, high nominal wage growth, and steady inflation. [Link, registration required]
Is ‘Secular Stagnation’ Too Pessimistic? By Jeffrey Sparshott (WSJ Real Time Economics)
A summary of the view that tightening labor markets will end the feared “secular stagnation”; a period of low growth, inflation, and interest rates with slack demand, high savings, and low investment. [Link]
Not So Rich Anymore, Gulf Arabs Enter World of Cuts and Strikes by Zainab Fattah (Bloomberg)
The end of high oil prices mean harder choices for the citizens of the Persian Gulf, including lower wages, fewer benefits, and a completely unsustainable economic model. [Link]
Security
Fear This Man by David Kushner (Foreign Policy)
A fascinating summary of the hacking empire run by David Vincenzetti, an Italian who runs the “Blackwater of surveillance”: selling the ability to hack and spy on electronic devices to the highest bidder, usually national spy agencies. [Link]
A Leak Wounded This Company. Fighting the Feds Finished It Off by Dune Lawrence (Businessweek)
The detailed account of LabMD, which was hacked after an employee downloaded file sharing software. But it was the Federal Trade Commission that dealt the heaviest blows. [Link]
Public Perception
Buying Yahoo Without Coming Off as One by Andy Kessler (WSJ)
A grim run-down of the mess that is Yahoo’s core business along with some strategies that buyers may be able to deploy. [Link, paywall]
Neil DeGrasse Tyson Is A Black Hole, Sucking The Fun Out Of The Universe (Wired)
The case that the pre-eminent public advocate for science is over-playing his hand. For the record, we think more knowledge of science is a good thing, even if it’s delivered in a smug wrapper. [Link]
Central Banking
The Tokyo Whale Is Quietly Buying Up Huge Stakes in Japan Inc. by Yuji Nakamura, Anna Kitanaka, and Nao Sano (Bloomberg)
Due to its purchases of equity ETFs (designed to reduce financial alternatives and goose investment) the Bank of Japan is now a bigger holder of Japanese stocks than either BlackRock or Vanguard. [Link]
The Edinburgh gambler and murderer who bankrupted France (The Scotsman)
A fun romp through the biography of Edinburgh’s John Law who witnessed the founding of the Dutch central bank and introduced paper money to the world; that particular experiment was one that failed miserably at the time. [Link]
Food
The sinister, secret history of a food that everybody loves by Jeff Guo (WaPo)
The type of food a society grows is now being focused on as a key driver of how that society advances, with root vegetables like the potato providing less incentive for the formation of social institutions that can be easily used for conquest or expansion. Thanks to our friend Eddy Elfenbein for passing this one along! [Link, soft paywall]
Start a 14-day no obligation free trial to sample Bespoke’s premium research. Our Bespoke Report newsletter sent to paid members every Friday is a great read if you’re looking for additional weekend reading.
The Bespoke Report — 4/29/16
Each week, Bespoke sends clients across all of its subscription levels the Bespoke Report newsletter. If you’re looking for Bespoke’s analysis of current market internals, economic data, earnings beats and misses, individual stock ideas, and more, the Bespoke Report has it all. If you sign up for a subscription between now and Sunday, you’ll receive a 20% discount for the life of your membership! Simply choose one of the offerings below to gain access to some of the best research you’ll find anywhere. Here’s a matrix of the products included with each level of service.
Newsletter Annual – $316/yr (20% off)
Newsletter Monthly – $39/mo (20% off)
Premium Annual – $795/yr (20% off)
Premium Monthly – $79/mo (20% off)
Institutional Annual – $1595/yr (20% off)
Institutional Monthly – $155/mo (20% off)
Below is a look at our asset class performance matrix using key ETFs traded on U.S. exchanges. We typically include this in our Bespoke Report newsletter mentioned above. Major equity indices in the U.S. fell over the last week to leave them up marginally for the month of April. While the S&P 500 and Dow both fell 1.3% on the week, the tech-heavy Nasdaq 100 (QQQ) got taken to the woodshed by 3%. The ETF for the index is now down 5.21% on the year while the S&P 500 SPY ETF is up 1.73%. That’s significant negative performance divergence for the QQQs due to big declines in some of the largest components like Apple (AAPL), Alphabet (GOOGL), and Microsoft (MSFT).
Outside of the US, Brazil’s market (EWZ) continues to surge higher as energy and commodity prices rebound. EWZ is now up 42.7% year-to-date. While Brazil is surging on the commodities rebound, Japan is faltering. The EWJ ETF fell 6.5% this past week alone as Japanese central bankers failed to provide investors with the accommodative monetary policy they craved.
Have a great weekend!

Bespoke’s Weekly Chart Book – 4/29/16
ETF Trends: Hedge – 4/29/16
US Production Not Responding To Higher Oil Prices…Yet.
At the peak for drilling activity in the United States, Baker-Hughes tallied 1,609 rigs operating in the US. As of today’s report, that number is down to 332, a fresh low, despite a huge uptick in prices since the low back in February. Spot WTI prices rose from $26.19 on February 11th to $45.83 today. But that 86% gain in prices has not yet led to an increase in production. Below we chart weekly data on US production from the Department of Energy’s Information Agency, quoted in millions of barrels per day. Weekly numbers can be pretty unreliable, so we’ve included monthly numbers as well. As shown, weeklies are making new lows and it looks likely the monthly figures will continue to do so as well. We’ve also included a chart of rig counts. As shown, rigs peaked and began to roll over in October of 2014, 7 months before monthly production peaked and almost 9 months before weekly production peaked. While soaring rates of productivity have made a big difference for the shale patch (more production from fewer rigs), it’s unlikely that we’ll see a material bounce in crude output without an uptick in rigs. In June of 2015, we saw a minor uptick in rigs. 4 months later weekly production numbers ticked up although monthlies were also slightly higher in short order. While a few incremental rigs could make a big impact on production in a very short period of time, our larger point is that it’s going to be very hard to boost production without boosting rigs, and despite a nearly constant 3 month rally in crude prices we haven’t seen those rigs come on line; in fact, quite the opposite.

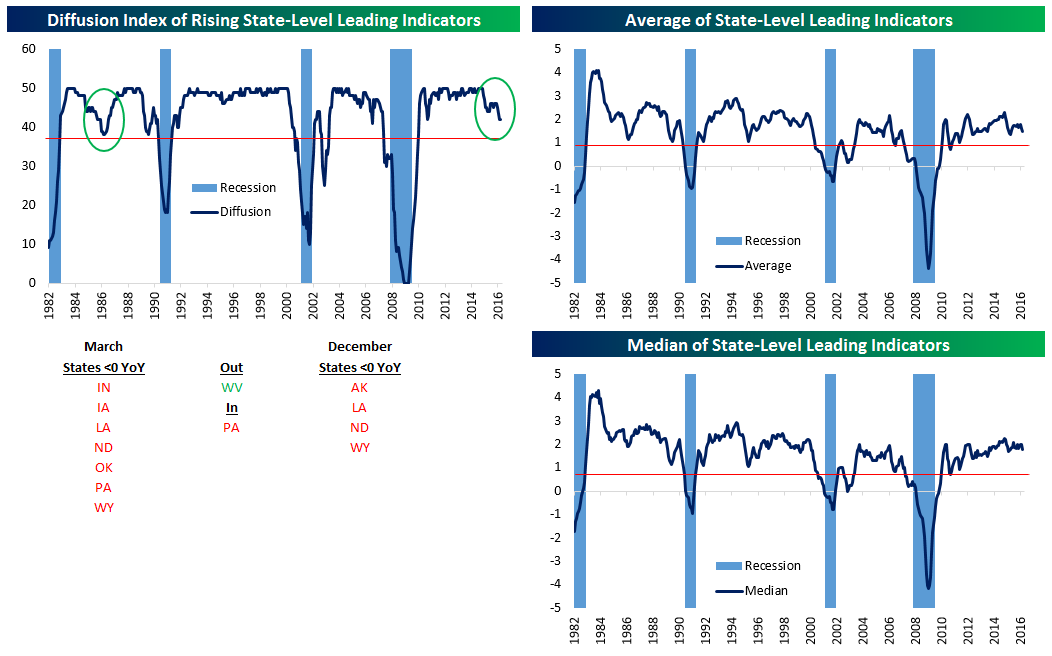
Leading Indicators Slow, But Only For A Few States
The Philadelphia Fed regularly publishes monthly indices of leading economic indicators for all 50 states. Aggregating this data is one way to look at the breadth of the economic expansion, and is also a good way to see what the outlook is for the broad economy. As recently as November 2014, all 50 states had leading indicator readings higher than the year previous. Since then, however, there’s been a marked deterioration as 6 states currently have negative leading indicator readings YoY.
Below at top left we chart a diffusion index which measures the number of states with leading indicators above 0. Only 44 states are positive YoY, with Indiana, Iowa, Louisiana, North Dakota, Oklahoma, Pennsylvania and Wyoming down YoY. West Virginia was down as-of February but ticked up, while Pennsylvania is a new addition to the negative category. That’s compared with four states (Alaska, Louisiana, North Dakota, and Wyoming) down or flat YoY as-of December. We note that most of states showing weakness (Louisiana, North Dakota, Oklahoma, and Wyoming) are highly dependent on petroleum extraction, a sign of the impact that the crash in oil has had on the US economy. While the current deterioration looks concerning, it’s not without precedent. In the mid-1980s, a similar mid-cycle pause took place. The red line indicates the level that has historically indicated a recession (i.e. “no going back”) in the past. We also include the average YoY change in leading indicators and the median YoY change. As shown, both are right in the middle of expansion territory, not showing a fantastic economy but not showing a huge recession risk either.