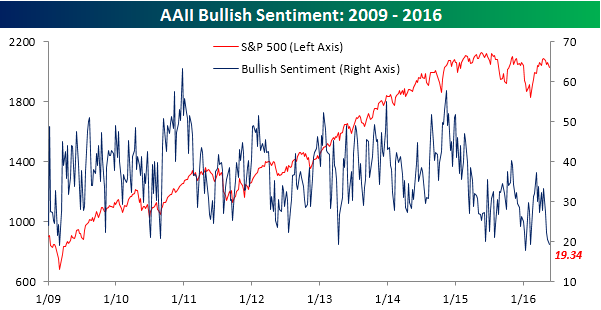
Bullish Sentiment Approaching 2016 Lows
Being bullish these days is about as popular as shopping at a department store. In the latest sentiment survey from the American Association of Individual Investors (AAII), bullish sentiment dropped from 20.41% down to 19.34%, representing the fourth straight weekly decline. This is the lowest weekly reading since early February and not much above the 2016 low of 17.9% in mid-January.
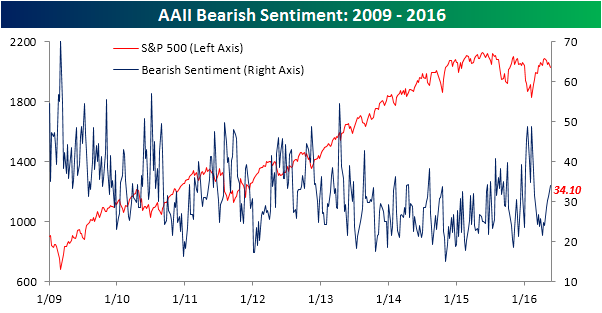
While bullish sentiment saw just a one percentage point decline, bearish sentiment increased by nearly three points, rising to 34.1% from 31.29%. Moving in the opposite direction as bullish sentiment, this is the fourth straight week where bearish sentiment increased. The last time it was this high was in the week of 2/18.
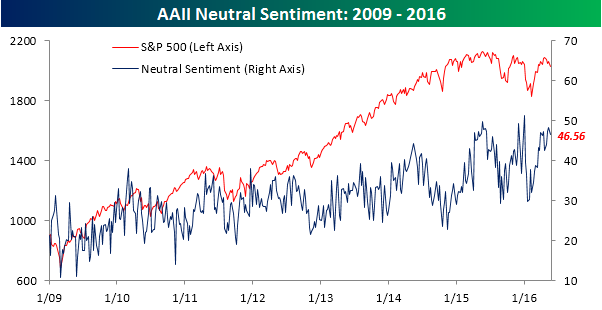
Levels of neutral sentiment pretty much sum up the market these days as investors aren’t bullish, but they haven’t necessarily been piling on in the bearish camp either. More accurately, with neutrals up in the high 40 percentage range, individual investors are increasingly indifferent as they have become each of the prior two times that the S&P 500 has approached 2,100.
Dynamic Upgrades/Downgrades: 5/19/16
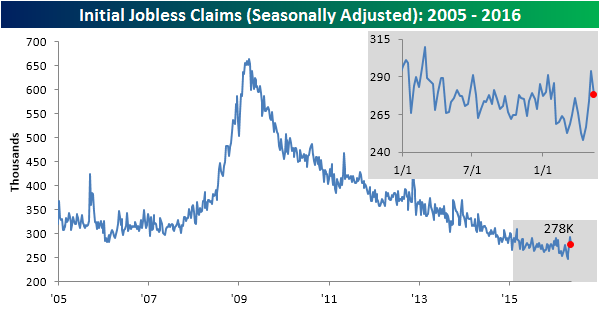
Jobless Claims Drop Less Than Expected
After what could only be classified as a disappointing report last Thursday, this week’s read on initial jobless claims declined, but by less than expected. While economists were expecting a reading of 275K, the actual reading was slightly higher at 278K. Despite the weaker than expected reading, claims continue to remain below 300K, which is a level that hasn’t been breached to the upside in 63 weeks now. Had claims actually edged higher and exceeded 300K, it would have raised serious concerns regarding the overall health of the jobs market.
 .
.
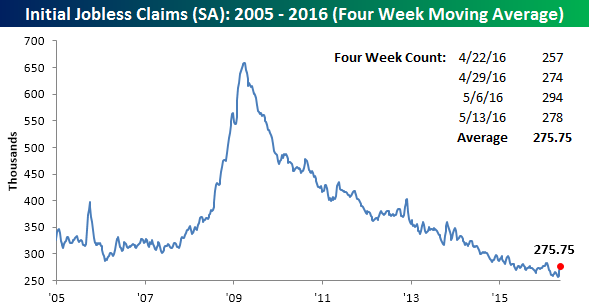
While the weekly reading declined, this week’s reading on the four-week moving average increased by another 7.5K to 275.75K, which is up nearly 20K from the multi-decade low reading of 256K from 4/22/16.
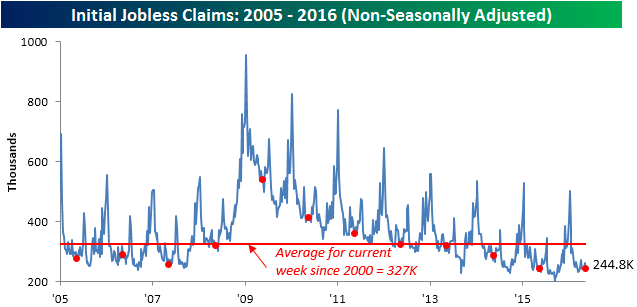
On a non-seasonally adjusted basis (NSA), claims dropped by 17.1K to 244.8K. That is actually up slightly from last year’s equivalent week, but well below the average of 326.9K for the current week since 2000.
Best Performing S&P 500 Stocks on Earnings
So far this earnings season, 43 stocks in the S&P 500 have gained more than 5% on their earnings reaction days (first trading day following earnings). Below is a list of these 43 large-cap earnings season winners. As shown, NVIDIA (NVDA) and Southwestern Energy (SWN) rank #1 and #2 with one-day gains of more than 15%. Electronic Arts (EA) ranks third with a gain of 13.7%, followed by Monster Beverage (MNST) and Boston Scientific (BSX). Norfolk Southern (NSC) is the only other S&P 500 name that gained more than 10%. Amazon.com (AMZN) came mighty close, though, with a gain of 9.57%.
Other notables on the list of earnings season winners include Expedia (EXPE), Facebook (FB), Under Armour (UA), Whole Foods (WFM), and Biogen (BIIB). Next to each of the stocks listed, we’ve also included how it has performed since the close on its earnings reaction day. This shows how the stock has done since its initial one-day earnings move. Some stocks have continued higher, but overall, the average change has been -0.70%. That means there hasn’t been much follow through to the upside even for this season’s biggest winners. Three stocks on the list — RRC, UA, CNC — gained more than 5% on their earnings reaction days but have since fallen more than 10%. Talk about a pump fake.
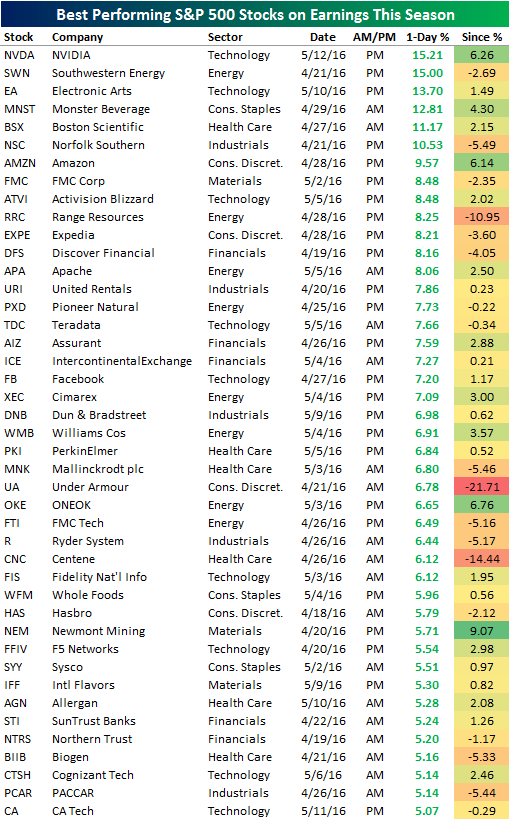
Chart of the Day: Earnings Follow Through
ETF Trends: Fixed Income, Currencies, and Commodities – 5/18/16
Below is a list of the best and worst performing ETFs across all asset classes over the last week. Biotech (XBI) is finally leading the list of winners again after struggling mightily for months. Natural gas (UNG), steel producers (SLX), and Brazil (EWZ) have been the biggest losers with declines of more than 7% over the last 5 trading days.

Bespoke provides Bespoke Premium and Bespoke Institutional members with a daily ETF Trends report that highlights proprietary trend and timing scores for more than 200 widely followed ETFs across all asset classes. If you’re an ETF investor, this daily report is perfect. Sign up below to access today’s ETF Trends report.
See Bespoke’s full daily ETF Trends report by starting a no-obligation free trial to our premium research. Click here to sign up with just your name and email address.
Fed Minutes On Tap
Despite covering a meeting from six weeks ago, and coupled with the large volume of commentary from Fed officials since then, the minutes of FOMC meetings always garner attention from investors and the financial media, if for no other reason than they are something to focus on. At the risk of piling on to the crowd and putting too much emphasis on the FOMC minutes, in the table below we have provided a summary of the S&P 500’s returns on the day of and day after prior releases of FOMC meeting minutes since the taper was fully wound down in late 2014.
On both a median and average basis, intraday S&P 500 returns leading up to the release of the minutes have been non-eventful with the S&P 500 posting returns right near 0% and gains half of the time. After the release of the minutes, though, returns have been biased toward the positive side with the S&P 500 averaging a gain of 0.16% (median: +0.04%) and positive returns ten out of twelve times. For the entire day, the S&P 500 has averaged a gain of 0.21% (median: 0.12%) with positive returns half of the time. While the day of the release is skewed positive, the day after has trended the other way with the S&P 500 averaging a decline of 0.28% (median: -0.02%) and positive returns half of the time. More recently, next day returns have been even weaker with four straight declines the day after.

Seasonality Doesn’t Prevent A Crude Build
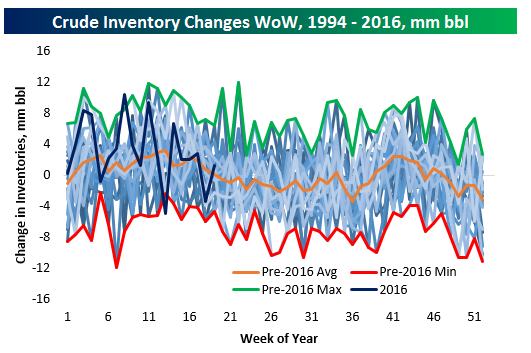
Despite the approach of summer driving season, very strong gasoline demand wasn’t enough to reduce US crude oil inventories on the week. The domestic US market consumed 9.28mm barrels of gasoline per day on average over the last 52 weeks, the most since July of 2008, while the domestic demand for gasoline reported for the current week was the second-highest since at least 1998 for a single week. Production of crude made a new low versus recent history at 8.79mm barrels per day. Still, crude inventories rose by 1.1 mm barrels. This is a relatively bearish result; May should see drawdowns of crude as refineries pump out summer gasoline for the height of the season. However, it’s not without precedent to see a build at this time of year. 12 of the last 22 years saw a build in the 19th week of the year. Below we chart the seasonality of crude oil inventory changes since 1994. As shown, while inventory builds have been elevated this year, they haven’t moved that far off the established seasonal pattern for oil markets.
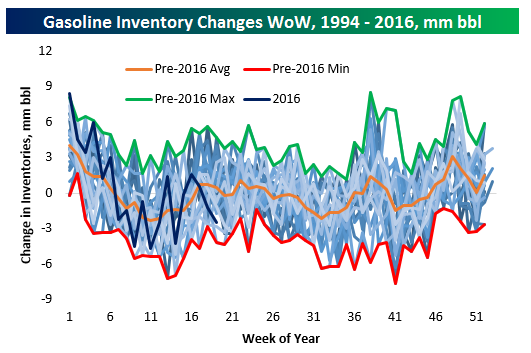
For gasoline, it’s a similar story. This week saw a 1.23 million barrel draw in inventories, which is larger than average for this time of year as shown in the chart below. Thus far in 2016, gasoline inventory draws have been performing about what you’d expect versus the seasonal trend. There are currently 24.4 days of gasoline supply in inventory, versus a one-year average of 24.67 days supply. That average has been pretty steady for the last six months; while crude inventories have risen dramatically versus demand (up to 29.48 days on a 52-week average basis from around 23 days at the end of 2014), gasoline inventories have basically matched the rapid expansion in gasoline consumption from the US market and are below the 52-week average 25.38 days supply in mid-2013.