Gas Prices Rising into Summer Driving Season
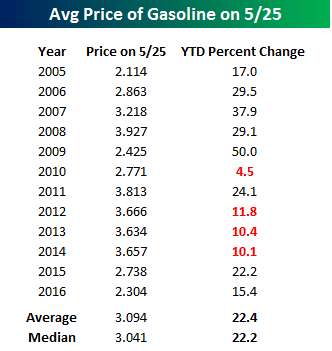 Summer driving season kicks off this weekend with the Memorial Day holiday weekend, and true to form gas prices have been rising sharply heading into it. From its low earlier this year, the national average price of a gallon of gas according to AAA has risen from under $1.70 per gallon to $2.30 for an increase of 36%. That is certainly a large increase in percentage terms, but for this time of year current prices remain below average. The table to the right compares the YTD change in gas prices through 5/25 in 2016 to each year since 2005. Despite the 15.4% YTD increase, two things to keep perspective of are the fact that this year’s YTD increase is still below the 22.4% average, and current prices are still more than 25% below the average price of $3.094 on this day since 2005. In fact, the only other year since 2005 where gas prices were lower at this time of year than they are now was in 2005.
While prices have been on the increase of late, if the historical pattern holds the bulk of the price gains for 2016 are likely in. As shown in the chart below, based on the average annual pattern for gasoline prices, prices tend to level out in the summer before declining once summer winds down.

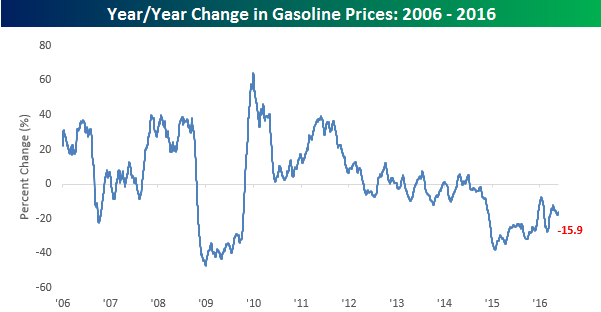
Finally, given the seasonal nature of gas prices, rather than focusing on where prices have moved relative to the last several weeks, it makes more sense to compare prices to where they were one year ago. The chart below shows the y/y change in gasoline prices going back to 2006, and on this basis prices are still moderately lower from where they were a year ago (-15.9%). What is most notable about this chart, though, is that prices have been down on y/y basis going all the way back to late 2014, so when you compound y/y declines they really start to add up. For instance, based on current levels, prices at the pump are down 37% from this time in 2014. So, while gas prices are rising, the days of $3 gas are still fresh in investors minds.
S&P 1500 Most Heavily Shorted Stocks: 5/25/16
Short interest figures for the middle of May were released after the close yesterday, and in the table below we have provided a list of the 25 S&P 1500 stocks that have the highest short interest levels as a percentage of float. Leading the list in this update is Cal Maine Foods (CALM), which has over half of its free-floating shares sold short. One factor not helping CALM is the price of eggs, which have dropped significantly from year ago levels, as the industry recovers from last years avian flu outbreak. Month to date, CALM is down nearly 10%, so for now, the negative bet is paying off. Behind CALM, Adeptus Health (ADPT) and LendingTree (TREE) both also have half of their free-floating shares sold short. That’s some pretty bearish sentiment!
In terms of overall performance, short-sellers should be having a pretty good month. As shown at the bottom of the table, the average performance of the 25 stocks listed is a decline of 6.93% (median: -5.98%) compared to a gain of 1.14% for the S&P 1500 as a whole. If you were to just pick 25 stocks at random, you would be hard-pressed to end up with an overall return that was as bad as the performance of this list.

Bespoke Short Interest Report: 5/25/16
Consumer Pulse: Ahead of the Data on Strong Housing Report
When we first set out and launched out Bespoke Consumer Pulse report two years ago, the goal was to survey thousands of US consumers in order to get an accurate read on trends in the US economy, US consumer stocks, and the financial markets. But to this day, we are still amazed at how often an economic report or earnings report is released and it confirms what we already knew based on the results of our surveys. Tuesday’s report on US New Home Sales was just another example. Check out the details below.
New Home Sales: Tuesday’s new home sales numbers grew at its fastest pace since January 2008. The Commerce Department said purchases of new, single-family homes increased 16.6% from a month earlier while the median price of a new home increased to $321,100, which is up 9.7% from a year ago and the highest level on record. The report also showed that inventories of new homes declined in April. This is a major contributor to the increase in price, and also bad news for potential new home buyers.
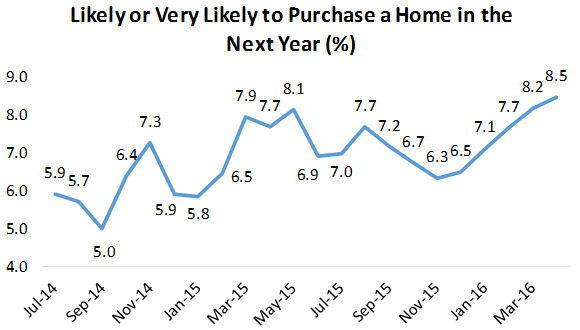
May Consumer Pulse Results: April’s strength in new home sales came as little surprise based on the monthly Bespoke Consumer Pulse report. According to our April report (released in early May), the highest number of respondents (8.5%) in our survey’s history reported they are either “likely” or “very likely” to purchase a home in the next year. Although there is some seasonality to the time series, we continue to believe that demand for housing in the US will remain strong as the trend is clearly higher. Based on the overall seasonal patterns, this series typically peaks in May or June and tends to bottom towards the end of the year.
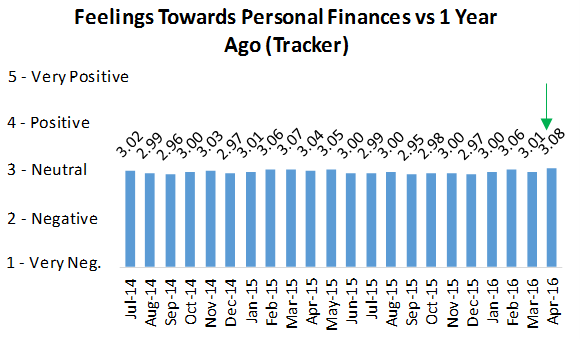
So why are so many Americans looking to buy a house with prices higher than ever and a shrinking pool of homes to buy from? Our Consumer Pulse report has also indicated that Americans are the most satisfied with their personal finances relative to a year ago in our survey’s history. Our monthly tracker had a weighted average reading of 3.08 in April- its largest sequential gain on record and just above the previous high. In short, people have the perception of more cash in their pockets and are much happier to spend it on, say, a new home.
Bespoke subscribers (and now non-subscribers too!) can purchase our Consumer Pulse survey analysis for just $365/year or $39.99/month (including a 30-day free trial). We have said it before, but we’ll say it again. The value in the Bespoke Consumer Pulse offering is tremendous. We strongly encourage you to give our Consumer Pulse subscription a try!
As a non-member, you can purchase Consumer Pulse below as a stand-alone product, or subscribe to one of our other memberships and get a big discount on Consumer Pulse. Click here to learn more about the product.
Annual — Bespoke Consumer Pulse — $365/Year w/ 1-Month Free Trial
Monthly — Bespoke Consumer Pulse — $39.99/Month w/ 1-Month Free Trial
ETF Trends: Fixed Income, Currencies, and Commodities – 5/25/16
EM has staged something of a turnaround in the last couple of days with South Africa and Turkey two prominent members of the best performing ETFs list below. Italy has also done well as a deal to secure the near future of Greece’s bailout was hammered out yesterday. Homebuilders continue to rally after a strong New Home Sales print yesterday and a solid MBA mortgage applications release this morning. Precious metals are the worst performers over the last week with numerous gold funds at the top of the list. The bouncing USD has hurt that trade with a number of currency ETFs also declining on the move.

Bespoke provides Bespoke Premium and Bespoke Institutional members with a daily ETF Trends report that highlights proprietary trend and timing scores for more than 200 widely followed ETFs across all asset classes. If you’re an ETF investor, this daily report is perfect. Sign up below to access today’s ETF Trends report.
See Bespoke’s full daily ETF Trends report by starting a no-obligation free trial to our premium research. Click here to sign up with just your name and email address.
Philly Sox Makes New 2016 High
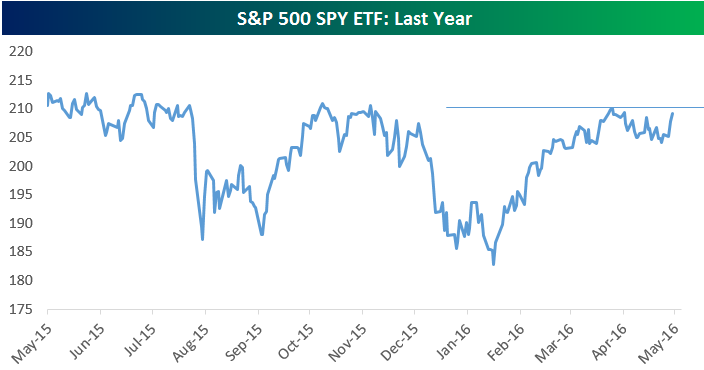
The S&P 500 is rallying for a second day in a row and is now less than a percent away from making a new 2016 high. As you can see in the one-year chart of the S&P 500-tracking SPY ETF below, once the 2016 high is cleared, it doesn’t have much farther to go to get to new one-year highs.
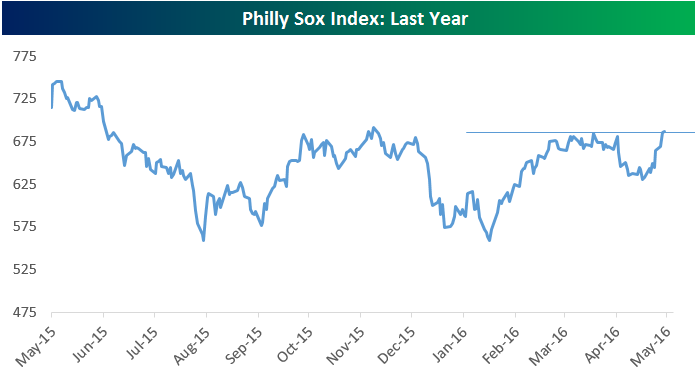
Semiconductors — often viewed as a leading group — have indeed made a new 2016 high today, as shown in the chart of the Philly Sox index below. Market bulls are hoping this rally in the semis foretells better days to come for the broad market.
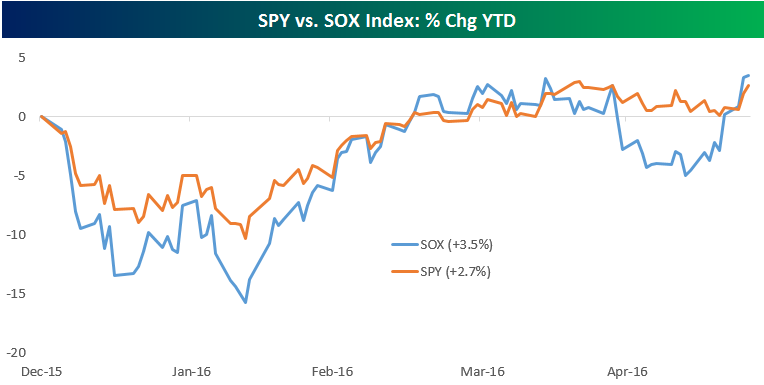
After falling more than 15% on a year-to-date basis by early February, the Philly Sox index has surged back and is now up 3.5% year-to-date. That’s 70 bps more than the 2.7% gain the S&P 500 has posted through this morning.
Crude Oil Inventories Fall More Than Forecast
Crude oil inventories for the latest week fell by 4.226 million barrels, which was more than the 2.65 draw-down that was forecasted. The chart below shows the current level of inventories to the historical average, the average over the last ten years, and last year (2015). Even with this week’s drawdown, inventory levels remain 190 million above (51%) their historical average for the current week of the year dating back to 1983. While inventory trends for 2016 are well above their historical average, they are following the following the typical pattern of rising through early May and then declining beginning in late May.
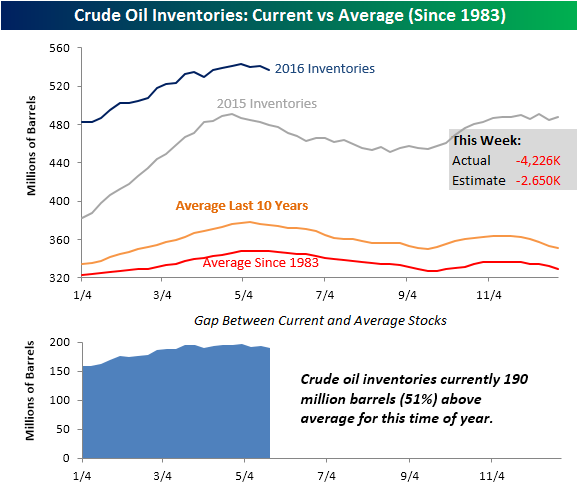
Chart of the Day – Memorial Day Week Returns
Dynamic Upgrades/Downgrades: 5/25/16
Bespoke CNBC Appearance (05/25)
Bespoke’s Paul Hickey appeared on CNBC’s Fast Money on Tuesday (5/25) to discuss the current odds on betting markets for this November’s Presidential Election, and what potential implications it has for the equity market. To view the segment, please click on the image below.
