B.I.G. Tips – Bulls Plummet, Neutrals Surge
Chart of the Day: Downtrend Break
Recent bullish action in a key asset class has caused an important break of downtrend, as you can see in the chart below.

Sign up for a 14-day free Bespoke trial below to find out what it is!
ETF Trends: US Indices & Styles – 5/26/16
Semis continue to lead with EM participation getting broader. Developed markets have also been quite strong as European megacaps in the Stoxx 50 make our best performers list along with Italy and France. Underperformers include bond funds, believe it or not, despite the +2 bps performance of TLT in the last week. Gold and other commodities, however, lead the negative readings over the past five days of performance with MLPs also starting to give up performance.

Bespoke provides Bespoke Premium and Bespoke Institutional members with a daily ETF Trends report that highlights proprietary trend and timing scores for more than 200 widely followed ETFs across all asset classes. If you’re an ETF investor, this daily report is perfect. Sign up below to access today’s ETF Trends report.
See Bespoke’s full daily ETF Trends report by starting a no-obligation free trial to our premium research. Click here to sign up with just your name and email address.
the Bespoke 50 — 5/26/16
Lowest Level of Bullish Sentiment in Over a Decade
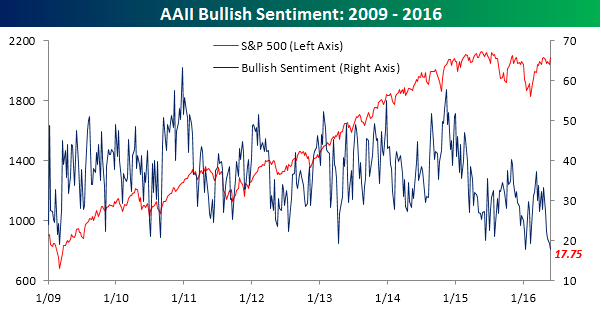
What rally? That’s what individual investors are saying this week as bullish sentiment dropped to not only its lowest level of the current bull market but also its lowest level in more than a decade. According to the American Association of Individual Investors (AAII), bullish sentiment declined from 19.34% down to 17.75% this week. That took out the prior bull market low of 17.9% from January.
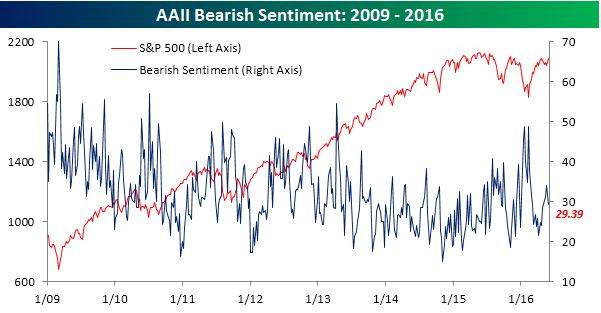
Although bullish sentiment declined, bearish sentiment actually declined as well and by a larger amount than bullish sentiment. As shown in the chart below, bearish sentiment fell from 34.1% down to 29.39%.
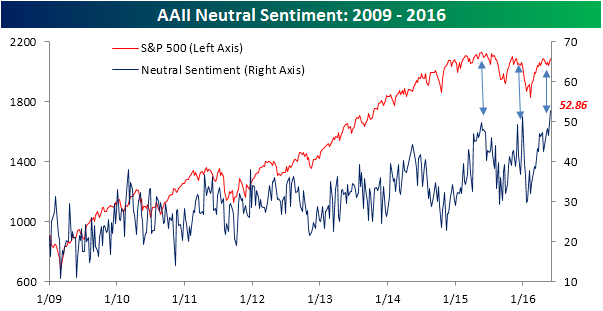
The real standout of this week’s sentiment survey was neutral sentiment. In this week’s survey, neutrals spiked 6.3 percentage points from 46.56% up to 52.86%. That’s an extraordinarily large number and signifies that investors are increasingly apathetic towards the market with little conviction in either direction. What is the most interesting about this trend is that in each of the three times that the S&P 500 has approached 2,100 in the last year or so, neutral sentiment spikes. In other words, as prices climb investors are doubting whether stocks can make another leg higher. Will the third time be the charm?
How Much Have Consumers Noticed Gas Price Increases?
Crude Sees New Highs: After seeing their highest levels in more than 80 years, oil stockpiles have fallen recently and coupled with declining US production, have helped to push prices to new 2016 highs. The Energy Department reported declines in US crude inventories and production on Wednesday, and prices increased to over $50 a barrel. The recent surge in prices of over 85% since the lows in February can be attributed to declines in supply in the US and globally as companies have cut spending on new exploration and production. Also, output has seen declines due to unexpected production outages from attacks in Nigeria to power cuts in Venezuela, and wildfires in Canada.
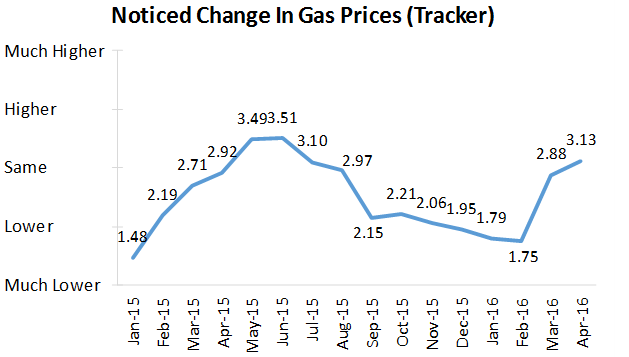
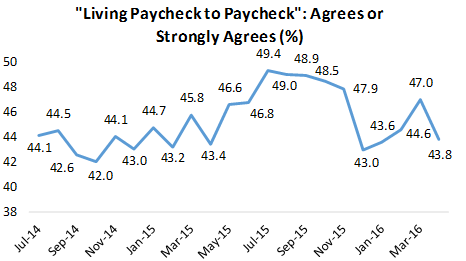
Survey Says: Building upon yesterday’s article on housing and consumer spending, our most recent Consumer Pulse survey report has indicated that consumers are highly in-tuned to changes in gas prices. In fact, our tracker even shows that consumers noticed the lows in February and have followed the recent price increases through April.
Despite the recent spike in gas prices, our survey has seen a sharp drop MoM in the number of Americans reporting that they live “paycheck to paycheck.” In our view, this shift was a key driver of improved consumer sentiment and activity improvement across all categories in our most recent Consumer Pulse report. This shift is also interesting because it goes against the conventional thinking that when gas prices increase, consumers tend to spend less. However, as we noted in yesterday’s article, consumers are the most satisfied with their personal finances relative to a year ago in our survey’s history. So even though gas prices are increasing just in time for the summer (they typically do), consumers are still confident about what is in their bank accounts.
You can purchase our Consumer Pulse survey analysis for just $365/year or $39.99/month (including a 30-day free trial). We have said it before, but we’ll say it again. The value in the Bespoke Consumer Pulse offering is tremendous. We strongly encourage you to give our Consumer Pulse subscription a try!
Click here to learn more about the Consumer Pulse offering, or go ahead and start a 30-day free trial using one of the checkout links below.
Annual — Bespoke Consumer Pulse — $365/Year w/ 1-Month Free Trial
Monthly — Bespoke Consumer Pulse — $39.99/Month w/ 1-Month Free Trial
Bespoke Bloomberg TV Appearance
Bespoke’s Paul Hickey appeared on Bloomberg’s Go earlier today to discuss the overall market and the impact of politics on financial markets. To view the clips, please click on the image or links below.

Bloomberg Go: Democrat Policies Favor Middle-Income Consumers
Bloomberg Go: Late Stage Economy Doesn’t Mean Weak Markets
Jobless Claims Resume Their Decline
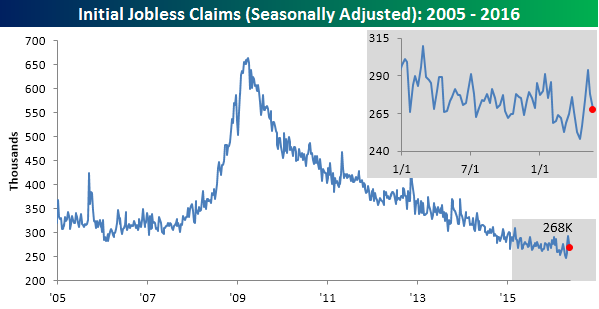
Jobless claims for the last week continued to decline from the mini-spike we saw in the prior few weeks. While economists were expecting first-time claims to come in at a level of 275K, the actual reading came in at 268K. That’s the lowest reading in four weeks and represents a decline of 26K from the short-term high of 294K two weeks ago. It has also now been 64 straight weeks since claims last eclipsed 300K on a weekly basis.
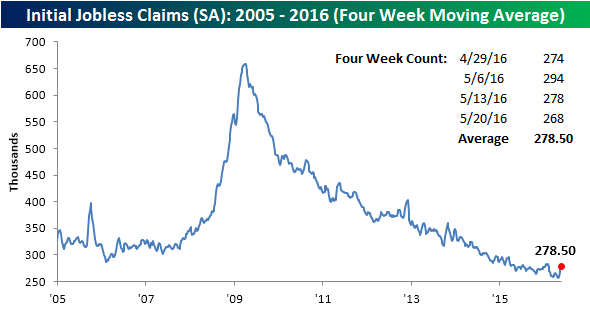
Even with the declines of the last two weeks, because it was dropping such low numbers in the prior two weeks, the four-week moving average increased once again this week for the fourth straight weekly gain. At a level of 275.5K, the moving average is now 22.5K above its multi-decade low of 256K from 4/22. While that level is unlikely to be broken to the downside anytime soon, given we will be dropping some relatively large readings in the next couple of weeks, it should decline nonetheless.
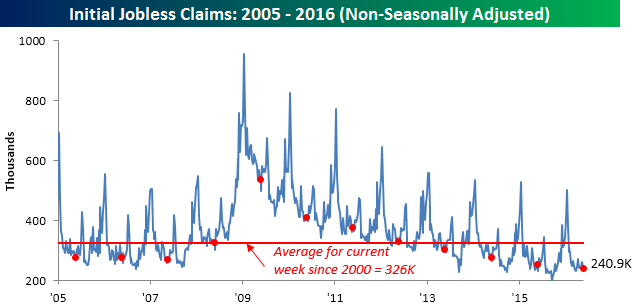
On a non-seasonally adjusted (NSA) basis, jobless claims edged lower by 4K down to 240.9K. For the current week of the year, this is the lowest level since 2000 and 85K below the average of the current week for every year since 2000.
Dynamic Upgrades/Downgrades: 5/26/16
The Closer 5/25/16 – “Monetary Mechanics, Petroleum Production”
Looking for deeper insight on global markets and economics? In tonight’s Closer sent to Bespoke clients, we dive deep into monetary velocity and the relationship between QE and growth in the money supply. In addition, we break down today’s weekly Department of Energy EIA data on crude oil inventories, product demand, and US oil production. We also provide key equity market stats and update the Bespoke Market Timing Model.

The Closer is one of our most popular reports, and you can sign up for a trial below to see it and everything else Bespoke publishes free for the next two weeks!
Click here to start your no-obligation free Bespoke research trial now!