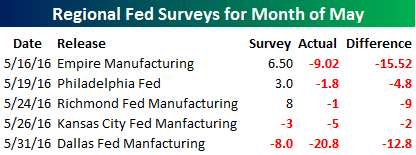
Fed Surveys O-fer the Month
The month of May certainly hasn’t been a good one for regional Fed surveys of business activity. With Tuesday’s weaker than expected Dallas Fed report, all five surveys for which there were estimates this month not only came in weaker than expected, but they’re also all in contraction territory. Let’s hope Wednesday’s ISM Manufacturing report isn’t as bad as these five reports from the New York, Philadelphia, Richmond, KC, and Dallas districts.
Bespoke Summary of Economic Indicators: 5/31/16
Bespoke Stock Seasonality: 5/31/16
Chart of the Day: Smart Money Indicator
In today’s Chart of the Day sent to paid research subscribers, we take a look at the “Smart Money Indicator,” which suggests that the “dumb money” trades at the open while the “smart money” trades at the close. In the report, we highlight the average path that the S&P 500 has taken throughout the trading day so far in 2016 to identify when selling or buying is occurring. A fascinating trend has emerged this year.
Sign up for a 14-day free Bespoke research trial below to find out what that trend is!
B.I.G. Tips — June Seasonality
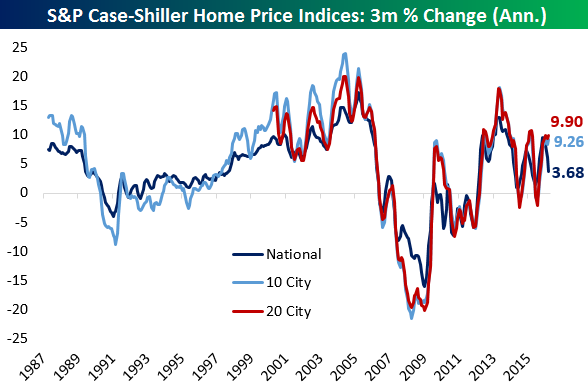
Case-Shiller Home Prices Continue To Rise Steadily
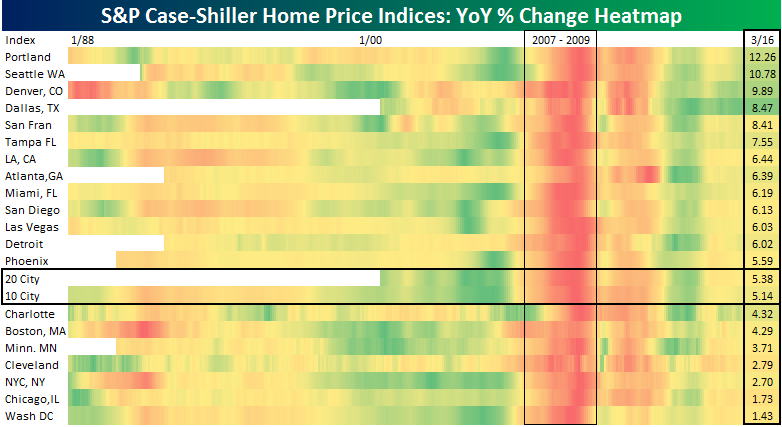
As shown below, Case-Shiller home prices for the 10 and 20 city composites saw an annualized increase of over 9% in the three months ending in March. The broader national composite rose 3.7% over the same period. The Pacific Northwest is by far the strongest region of the country, with prices rising 14.6% in Portland and 16.1% in Seattle over the last three months. Charlotte (+3.76%), Phoenix (+3.92%) and NYC (+4.43%) were the weakest. Versus this time last year, Washington DC has been the softest market, up a paltry 1.4%, while Chicago prices have only risen 1.7%. Portland and Seattle are both up double-digits, while Denver (+9.89%) is also strong. Despite weakness across the Texas economy thanks to low oil prices, home prices in Dallas are up 8.5% over the last year, the fourth-strongest in the country.
Below is a heatmap of home price appreciation across the country:
Dallas Fed Heads South
So much for a recovery in the state of business activity in the Dallas Fed region. In today’s report from the Dallas Fed on Business Conditions in the area, the overall index of General Business Activity declined from -13.9 down to -20.8. Economists were actually forecasting this index to improve to -8.0. While the decline is a disappointment, it is still well above its lows from earlier this year. Looking at the commentary from various industries generally shows a trend where demand is soft, but what really stands out is the concern over new Department of Labor overtime rules. One respondent went so far as to note that, “what the federal government currently decides to spend its time on is almost always neutral or detrimental to improving the economy.”
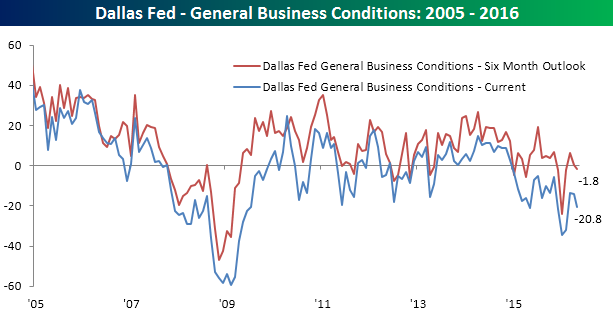
The table below summarizes the internals of this month’s report in terms of both current conditions and the six-month outlook. For current conditions, just five out of seventeen of the categories listed below saw a m/m increase with the biggest declines coming from New Orders, Capacity Utilization, Production, and Shipments. In terms of expectations, the breadth of the report was even worse with just two components showing sequential improvement. The categories where business owners are expecting the most weakness is in Hours Worked and New Order Growth. The drop in expectations for hours worked is no doubt the result of the new overtime rules that so many manufacturers highlighted. In fact, that component is now at its lowest level (-4.4) since February 2009.

With the data above, we have created six-month average diffusion indices of the Dallas Fed report for both current conditions and the six-month outlook. Not surprisingly, this month’s weakness brought down both diffusion indices. However, while the current conditions diffusion index saw only a small decline (2.00 down to 0.67), the diffusion index for the outlook fell back down close to what are the lowest levels of the last ten years.

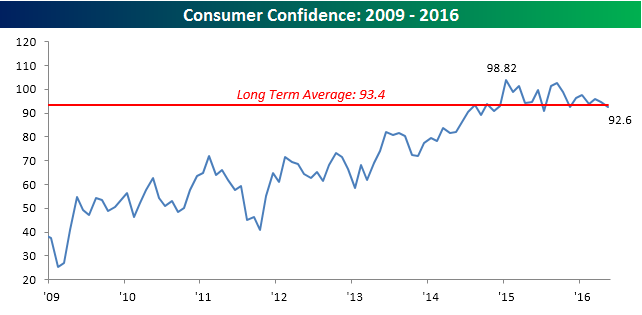
Consumer Confidence Misses Estimates
After two straight better than expected monthly readings, Consumer Confidence for the month of May unexpectedly fell, falling from a revised 94.7 down to 92.6 (expectations were for an increase to 96.1). As shown in the chart below, this month’s decline takes the headline index back below its historical average of 93.4 dating back to 1967. After that initial surge in early 2015, Consumer Confidence just hasn’t been able to break away from its long-term average.
As we have noted numerous times in the past, while overall Consumer Confidence has been relatively weak during the current cycle, depending on income levels, confidence levels have varied widely. In this month’s report, confidence among consumers with incomes greater than $50K declined from 112.5 down to 111.1. Even after the decline, confidence among higher-earning consumers is still well above its historical average of 104.6. Confidence among lower income consumers with incomes between $35K and $50K, however, shows the complete opposite picture. In May’s report, sentiment for consumers rose from 73.5 up to 78.4, but even after that increase, confidence remains well below the historical average of 78.4. As shown below, while the confidence indices for both income levels bottomed out at right about the same levels in 2009, the gap between them has been widening over time. The reason for the wide gap is relatively straight forward: incomes have stagnated while asset prices have surged. Therefore, consumers with more investable income have seen their financial picture improve considerably more than those without investable assets.

The final chart below shows the widening spread in greater detail. Last May, the six-month average spread in confidence between both income levels peaked out a record 32.42. In the second half of the year, the wide gap corrected somewhat along with the stock market, but in the last couple of months, it has shot right back up again, following the lead of the equity market.

Dynamic Upgrades/Downgrades: 5/31/16
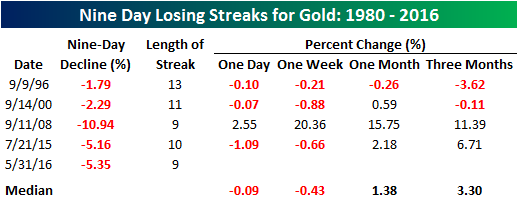
Gold Down Nine Days in a Row
Ever since those FOMC minutes from the April meeting came out back on 5/18, gold has been in an absolute tailspin. As shown in the chart below, prices have now declined in every session since the release of the minutes. They’re now testing their March lows and are on pace for their lowest close since early February.
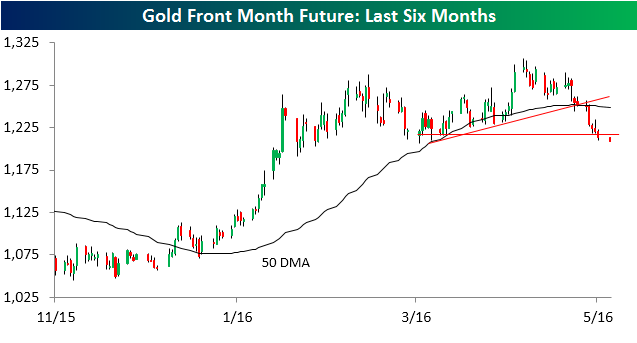
With gold on pace for its ninth straight day of declines, it is on pace for its longest streak of daily declines since last July and only the fifth such streak since 1980. The table below lists each of the prior streaks where gold was down at least nine trading sessions in a row and shows the metal’s performance over the following day, week, month and quarter. As shown in the table, of the four prior streaks, three went on to at least a tenth day with one (1996) stretching as long as thirteen trading days. Over the course of the current nine days of declines, gold is down 5.35%, which would rank as the second worst behind the 10.94% decline in the nine-day streak back in September 2008. Following that streak, gold saw quite the snap back rally, but following the other three, the returns were nothing to get overly excited about.