Consumers In Good Shape, But Price Expectations Slip
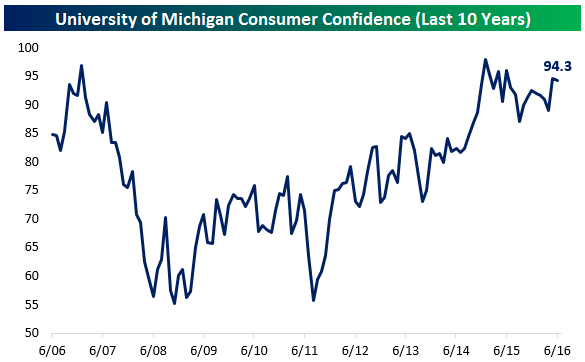
Today’s University of Michigan Consumer Sentiment index beat expectations, coming in at 94.3 versus 94.7 in May and 94.0 expected this morning. As shown, consumers are broadly optimistic and the confidence index has been in a range similar to that of the last expansion’s peak for about two years now.
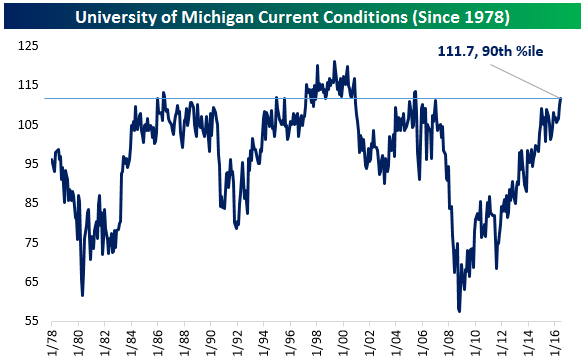
The current conditions index was especially strong, shooting to a new expansion high for the month. That’s despite worries over job creation and rising (though still low) gas prices, and largely confirms low jobless claims and moderately accelerating wage data. The current conditions index is now higher than 90% of prior readings dating back to 1978, which stands in stark contrast to the dim view of the global and US economies that professionals and the media often focus on – including us!
The major piece of bad news in the report: inflation. Expectations for inflation over the five years starting five years from today fell to the lowest on record, 2.3%. While that’s still above the FOMC’s target of 2% long-run inflation, it’s a continuation of a slide that’s been in place since 2014. While it may be easy to interpret the chart below as consumers expecting deflation, as Matthew Boesler of Bloomberg notes, the decline is mostly due to fewer consumers expecting very high inflation. That, combined with the still-over-2% level, is one small piece of solace for monetary hawks; the lower inflation expectations get, the more inclined the FOMC will be towards accommodative policy, all else equal.

Dynamic Upgrades/Downgrades: 6/10/16
The Closer 6/9/16 – “Flowing Funds”
Looking for deeper insight on global markets and economics? In tonight’s Closer sent to Bespoke clients, we dive into the guts of the Federal Reserve’s Z.1 report on the United States flow of funds and macroeconomic balance sheets. Below we show the corporate financing gap (capex less inventory valuation changes and internally generated funds) which has dropped sharply since a recent post-recession high, suggesting that businesses are not over-investing.

The Closer is one of our most popular reports, and you can sign up for a trial below to see it and everything else Bespoke publishes free for the next two weeks!
Click here to start your no-obligation free Bespoke research trial now!
ETF Trends: International – 6/9/16
Below is our daily list of the twenty best and twenty worst performing ETFs over the last five trading days. The list of best performers is dominated by natural resources, led by gold and oil exposures. Steel, Silver, and Precious Metals also rank highly. Biotech stocks have plummeted in value, topping the list of worst performers, a sharp contrast from a week ago when they led the top performers. The exposures for emerging Latin America, Middle East & Africa, and Europe continued to perform strongly. Banking related stocks continue to flounder. Retail exposures have also performed poorly as have hedged European and Japanese exposures.

Bespoke provides Bespoke Premium and Bespoke Institutional members with a daily ETF Trends report that highlights proprietary trend and timing scores for more than 200 widely followed ETFs across all asset classes. If you’re an ETF investor, this daily report is perfect. Sign up below to access today’s ETF Trends report.
See Bespoke’s full daily ETF Trends report by starting a no-obligation free trial to our premium research. Click here to sign up with just your name and email address.
Chart of the Day: Consistency of Buying
Bespoke’s Sector Snapshot — 6/9/16
We’ve just released our weekly Sector Snapshot report (see a sample here) for Bespoke Premium and Bespoke Institutional members. Please log-in here to view the report if you’re already a member. If you’re not yet a subscriber and would like to see the report, please start a 14-day trial to Bespoke Premium now.
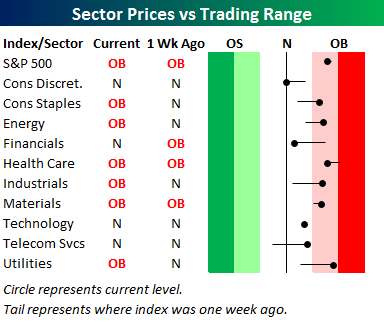
Below is our trading range screen of the S&P 500 and its ten sectors. For each sector, the dot represents where it’s currently trading within its range, while the tail end represents where it was trading one week ago. Moves into the red zone are considered “overbought,” while moves into the green zone are considered “oversold.” While the S&P 500 has barely budged within its range over the last week, we’ve seen a lot of underlying sector movement. Consumer Staples, Energy, Industrials, Materials, Telecom and Utilities have all moved higher, while Consumer Discretionary, Financials, and Health Care have moved lower.
To see our full Sector Snapshot with additional commentary plus six pages of charts that include analysis of valuations, breadth, technicals, and relative strength, start a 14-day free trial to our Bespoke Premium package now. Here’s a breakdown of the products you’ll receive.
the Bespoke 50 — 6/9/16
Jobless Claims Resume Downward Trend
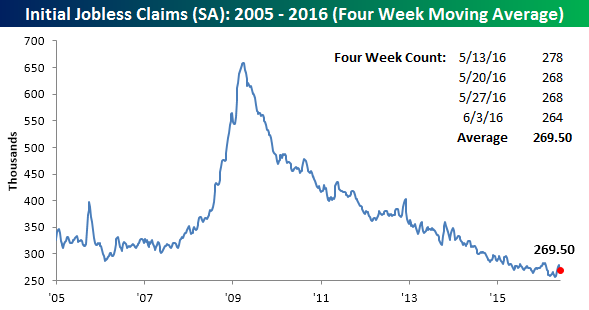
After a brief scare in early May where first-time claims spiked up to 294K, jobless claims have resumed their downward trend going five straight weeks without a weekly increase. In this week’s report, economists were expecting first-time claims to come in at a level of 270K, but the actual reading came in at 264K. That reading is still 16K above the multi-decade low of 248K from mid-April, but it’s down 30K from the recent high on 5/6.
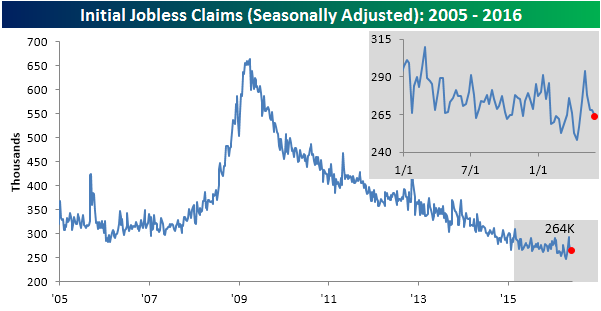
With the 294K reading from five weeks ago dropping off the count, the four-week moving average dropped by 7.5K this week to 269.5K. That represents a four-week low but is still 13.5K above the multi-decade low of 256K from seven weeks ago.
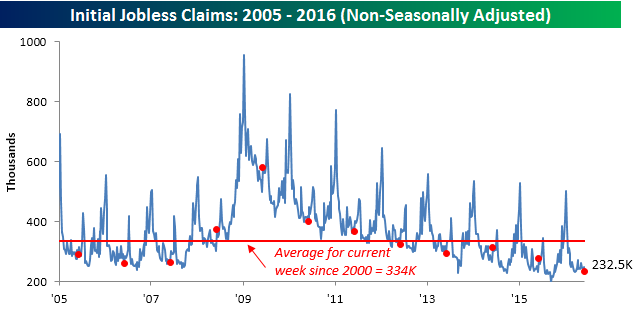
On a non-seasonally adjusted basis (NSA), jobless claims dropped to 232.5K from 247.1K. That’s more than 100K below the average for the current week of the year dating back to 2000 and the lowest level of NSA claims for the current week of the year since 1974!
Bulls and Bears in Equilibrium
Investor sentiment for the latest week showed an equal amount of bulls and bears for the first time in close to two years (7/31/14), and for both camps the level of conviction is pretty low. According to the American Association of Individual Investors (AAII), bullish sentiment came in at 27.83%, down from 30.17% last week. This marks the 32nd straight week where bullish sentiment has been below 40%. Bearish sentiment saw a similar decline this week, falling from 29.05% last week to 27.83%. With both bulls and bears declining, neutrals increased back up to 44.34%, which has tended to be the trend with sentiment every time the S&P 500 gets back above 2,100.


The Closer 6/8/16 – “Slack Or Structure?”
Looking for deeper insight on global markets and economics? In tonight’s Closer sent to Bespoke clients, we go into detail on labor market slack and the structural factors behind still elevated unemployment relative to other measures of labor market demand. We also recap today’s record-setting 10 year note auction and the weekly release of DoE EIA petroleum data.
The Closer is one of our most popular reports, and you can sign up for a trial below to see it and everything else Bespoke publishes free for the next two weeks!
Click here to start your no-obligation free Bespoke research trial now!