Bespoke’s Sector Snapshot — 6/16/16
We’ve just released our weekly Sector Snapshot report (see a sample here) for Bespoke Premium and Bespoke Institutional members. Please log-in here to view the report if you’re already a member. If you’re not yet a subscriber and would like to see the report, please start a 14-day trial to Bespoke Premium now.
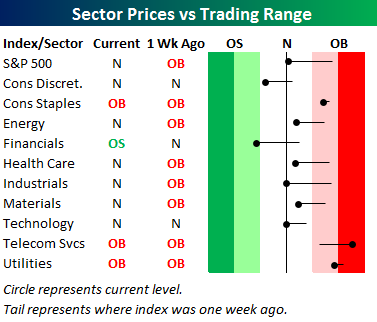
Below is our trading range screen of the S&P 500 and its ten sectors. For each sector, the dot represents where it’s currently trading within its range, while the tail end represents where it was trading one week ago. Moves into the red zone are considered “overbought,” while moves into the green zone are considered “oversold.” The S&P 500 slipped below its 50-day moving average this morning, but an afternoon rally left the index just above its 50-day by the close. The Industrials and Technology sectors are now sitting right on top of their 50-days as well. The only two sectors below their 50-days are Consumer Discretionary and Financials, while Utilities, Consumer Staples and Telecom are overbought.
To see our full Sector Snapshot with additional commentary plus six pages of charts that include analysis of valuations, breadth, technicals, and relative strength, start a 14-day free trial to our Bespoke Premium package now. Here’s a breakdown of the products you’ll receive.
Six Day Losing Streaks
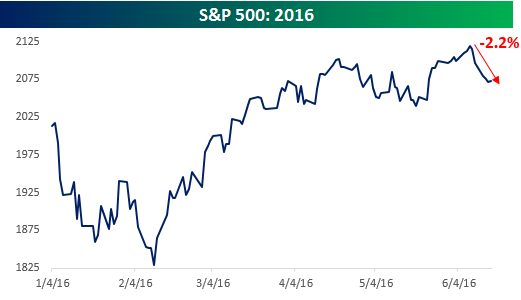
It was just over one week ago that the S&P 500 closed at its high for the year, and we haven’t had an up day since. Whether it’s fears over a potential Brexit, concerns regarding the economy, or that the FOMC has lost all credibility, investors have become increasingly concerned. Earlier today, it looked like a sixth straight down day was a sure thing, but since European markets closed just before lunch, the S&P 500 has rallied, making it a closer call. As we type this, the S&P 500 just flipped into the green. Looking at the chart below, even with the weakness we have seen over the last week or so, the S&P 500 is still only a little more than 2% off its 2016 closing high for the year. From that perspective, can you recall a time when the S&P 500 was this close to a high for the year but where there was this much angst on the part of investors?
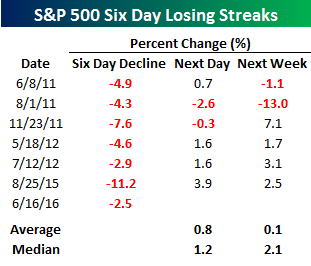 While a six-day losing streak for the S&P 500 is far from a done deal at this point, should we close in the red on Thursday it will be the seventh six-day losing streak since the bear market low in March 2009. In the table to the right, we have listed each of those streaks. For each occurrence, we show the six-day percentage declines as well as the S&P 500’s return the next day and over the next week. As shown, only two of the prior six streaks went on to a seventh down day, and the average return on day seven is a gain of 0.8% (median: 1.2%). Also, in five of the seven periods the S&P 500 was up over the following week for an average return of 0.1%. One of those down periods was in August 2011, and in the days that followed, S&P cut its AAA rating on US sovereign debt. That led to a decline of 13.0% over the next week. On a median basis, however, the S&P 500 has risen by 2.1% over the next week.
S&P 500 Still Stuck in the Middle
Below is a look at our trading range chart of the S&P 500 over the last year. The blue shading represents between one standard deviation above and below the 50-day moving average. This is the index’s standard “trading range.” Increased volatility will cause the range to widen, while low vol will cause it to tighten. You can see in the chart that we’ve seen significant tightening of the range over the last couple of months as the market has traded sideways. Even after five straight days of declines, the S&P is pretty much right in the middle of its trading range right now. It’s also still nicely above its lows from the pullback we saw in mid-May. Until those lows break, investors should be looking for a bounce and eventual test of its highs from early June.

Breadth levels have weakened a bit over the last five days, and 48% of stocks in the S&P 500 are now trading above their 50-day moving averages. Consumer Discretionary has the weakest breadth of any sector at the moment with just 28% of its names above their 50-days. Even the beaten down Financial sector has a stronger breadth reading at the moment than Consumer Discretionary. On the upside, two defensive sectors — Utilities and Consumer Staples — now have the strongest breadth readings as investors have recently flocked to safety and high dividends.
If you’ve never had a chance to check out Bespoke’s premium stock market research, we’d urge you to do so by starting a 14-day no-obligation free trial today. We’ll be sending out our weekly Sector Snapshot later this afternoon with additional analysis.

the Bespoke 50 — 6/16/16
Chart of the Day – Bad Banks
Everybody knows that banks have been under a world of hurt given the current ultra-low interest rate environment. Pull up a chart of any bank stock and the chart is the same; it starts at the upper left and ends at the lower right. The S&P 500 Bank Index looks the same, and from its high last year, it’s down 20%.

In today’s Chart of the Day sent to paid subscribers, we look at the performance of US Banks and how they compare to Banks in Europe in both absolute and relative terms. To view the report, please start a 14-day free trial below.
Bespoke Q3 Market Outlook
In April, we published our quarterly outlook report and held our first ever conference call for Bespoke clients. Based on the positive feedback, we will make this a regular feature of the Bespoke membership. Our next call is scheduled for next week on Friday, June 24th. Prior to that, we’ll publish The Bespoke Report: Q3 2016 Outlook on Wednesday, June 22nd. We’ll re-visit our stance from last quarter’s outlook and our annual outlook report (published in January) that despite anticipated volatility, equities have some key tailwinds to support a rally through year-end. Clients will also have an opportunity to submit questions for the Bespoke team to answer on the call. Between Fed expectations, Brexit and a global equities swoon, the Q&A is sure to be lively!
The quarterly outlook report and the conference call are for Bespoke clients only. Please review our subscription options and choose the annual or monthly plan that best suits your needs. If you’re not ready to purchase today, you can start a 14-day trial. Please note, however, that the outlook report and conference call are only available with a paid subscription, not with a free trial.

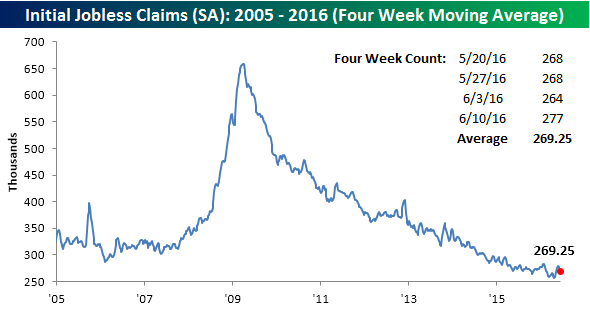
Jobless Jump to a Four-Week High
After five straight weeks without an increase, weekly jobless claims increased by 13K to 277K from last week’s level of 264K. This morning’s reading was 7K above consensus expectations of 270K. The streak of sub-300K readings continues unabated, though, at 67 weeks. You have to go all the way back to 1973 to find a streak of sub-300K readings that was longer.
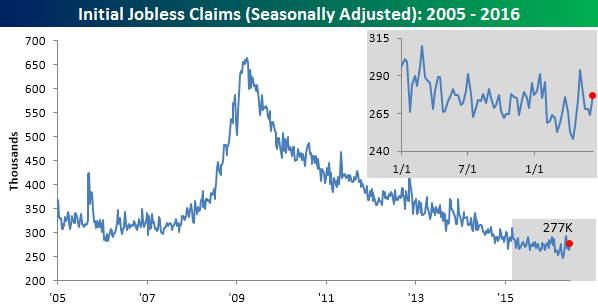
In spite of this week’s increase in claims, the four-week moving average actually saw a slight decline falling from 269.5K down to 269.25K. This is 13.25K above the cycle low of 256K that we saw eight weeks ago on 4/22/16.
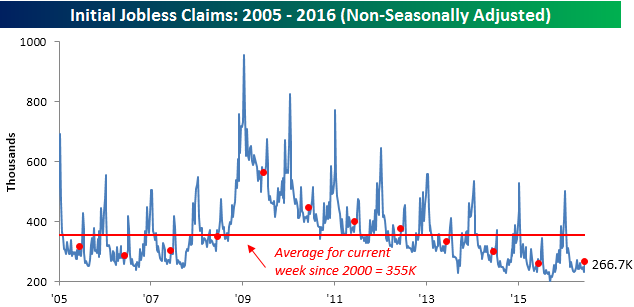
On a non-seasonally adjusted (NSA) basis, jobless claims increased by 33.8K up to 266.7K from 232.9K. For the current week of the year, this is 88K below the average since 2000, but higher than last year’s level of 258.8K.
Here Come The Bears
All it takes is one bad week these days. After closing at its high for the year last Wednesday, the S&P 500 has seen five straight down days (and on pace for a sixth). In that period, the S&P 500 is down a little over 2%, which has been enough for investors to sour on equities once again. According to the weekly sentiment survey from the American Association of Individual Investors (AAII), bullish sentiment declined from 27.83% last week to 25.35% this week, representing the 33rd straight week that bullish sentiment has been below 40%. We would also note that outside of one week last October, bullish sentiment has been below 40% since March 2015. That also happens to be right around the time the S&P 500 first started flirting with 2,100.
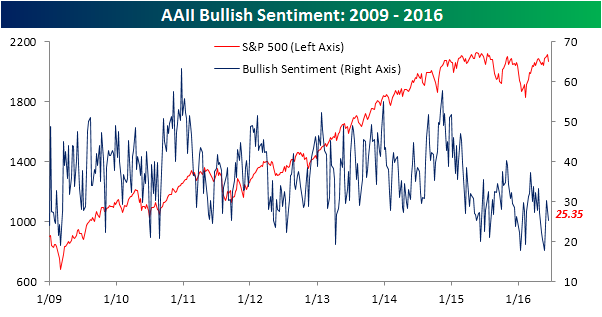
As mentioned above, the five-day losing streak for equities has really hit a nerve for investors and that has caused bearish sentiment to spike from 27.83% last week to 37.5% this week. That’s the highest reading in bearish sentiment since 2/18 and the greatest one-week increase since the week of 2/11. While this is a relatively high reading compared to the last three months, bearish sentiment is still well below the 48.7% readings we saw back in January and February.

The Closer 6/15/16 – “Fed Frustration”
Looking for deeper insight on global markets and economics? In tonight’s Closer sent to Bespoke clients, we give our thoughts on the FOMC and the price reaction from markets. We also summarize two major economic releases from this morning.

The Closer is one of our most popular reports, and you can sign up for a trial below to see it and everything else Bespoke publishes free for the next two weeks!
Click here to start your no-obligation free Bespoke research trial now!
Bespoke Consumer Pulse Sentiment Indices Composite: June 2016
You do not currently have access to this report. Purchase a Pulse add-on subscription here.