B.I.G. Tips – A Historical Sell Off
The results of the UK referendum last Thursday really caught the market leaning in the wrong direction and going forward a massive fog of uncertainty looms over the market regarding how the entire drama will transpire. Over the weekend, we published a flowchart detailing some of the possibilities regarding how things could play out, but even this complicated web of scenarios doesn’t take into account all of the unknown secondary and tertiary effects. Absolutely nobody knows how, when, and on what terms the UK and EU will work things out. It is just going to take time.
With the understanding that the path forward is murky, we compared the two-day sell-off in equities on Friday and Monday to prior periods in history to get a sense of perspective of where things stand and how the market has reacted in the past. For starters, while the decline in US equities has been sharp, it doesn’t even compare to some of the currency adjusted returns European stocks have weathered. For instance, in many major European benchmarks, stocks dropped more in two days than they have in all but the most extreme two-day periods of the last 30 years. In a B.I.G. Tips report just sent to Bespoke Premium and Bespoke Institutional members, we put the magnitude of the declines Friday and Monday into perspective relative to other steep two-day declines in history. Read the full report by signing up.
See the full B.I.G. Tips report by signing up for a monthly Bespoke Premium membership now. Click this link for a 10% discount ($89/month).
Bespoke Stock Scores: 6/28/16
S&P 1500 Most Heavily Shorted Stocks
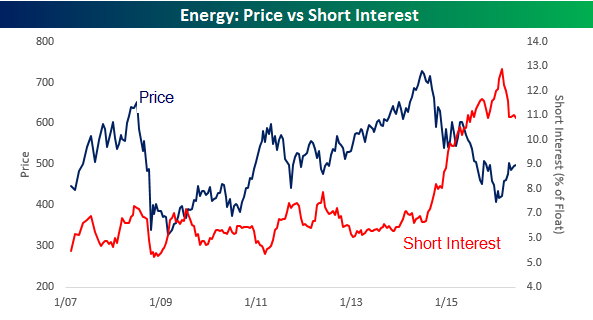
Short interest figures for the middle of June were released after the close on Friday, and yesterday we sent out our regular update of trends and statistics regarding short interest levels for different sectors and groups, including how they have performed relative to their short interest levels. One interesting chart that stood out is the interplay between short interest and price in the Energy sector. As shown in the chart below, there has been strong inverse correlation between the two where falling prices have been accompanied by rising average levels of short interest as a percent of float and vice versa. Earlier this year, when the Energy sector was at multi-year lows, short interest as a percentage of float for the sector was at levels similar to the Financial sector during the crisis. Now, as prices have rebounded, shorts are scrambling to cover, although at a level of around 11% the sector still has the highest levels of short interest.
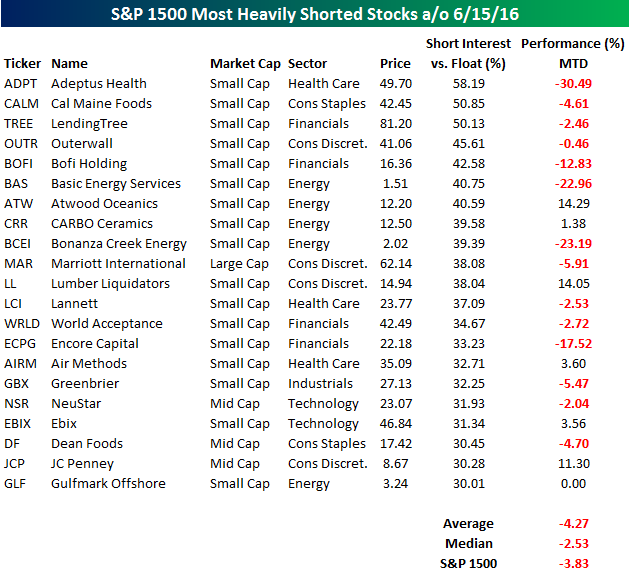
The table below lists 21 stocks in the S&P 1500 that have more than 30% of their free-floating shares sold short. For each name, we also include the stock’s performance so far in June. Overall, the performance of these stocks hasn’t been too far off from the overall market. On an average basis, these 21 names are down more than the S&P 1500 (-4.27% vs -3.83%), but on a median basis they are faring better. What is interesting to note, though, is that the six stocks that have the highest short interest levels are all down in June.
;
Chart of the Day: The Kids Are Alright
Big Beat in Consumer Confidence
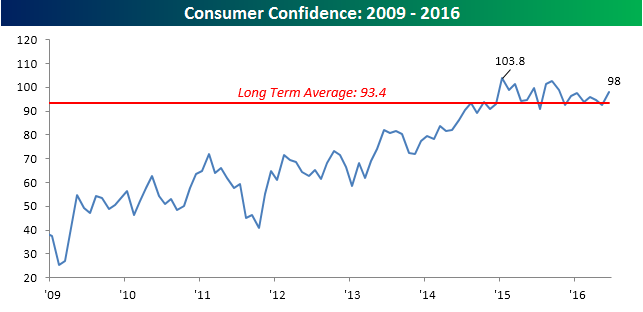
Today’s report on Consumer Confidence for the month of June came in significantly better than expectations. While economists were expecting the headline reading to show just a modest increase to 93.5 from last month’s reading of 92.4, the actual reading came in at 98. That is the highest reading since October, and the best report relative to expectations since September. One caveat to keep in mind here, though, is that this data is pre-Brexit. The chart below shows the headline Consumer Confidence index dating back to 2009. At the current level of 98, the headline index is back above its long-term historical average, but still six points below the cycle high of 103.8 from January 2015.
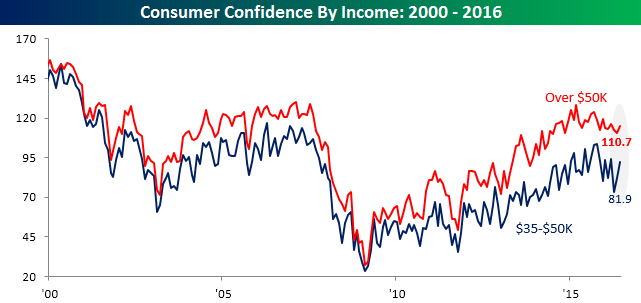
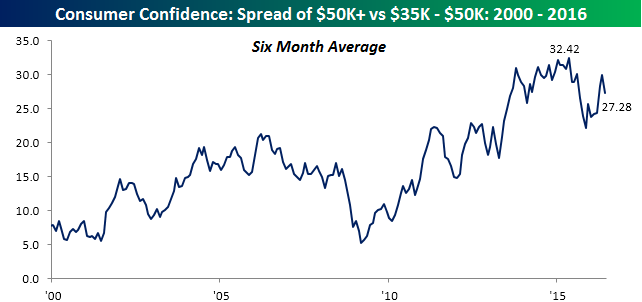
As we do each month, we wanted to update the divide between Consumer Confidence among consumers based on income. As shown in the top chart below, both consumers with incomes above $50K and below $50K saw an increase in confidence, although the bounce for lower income consumers ($35K-$50K) was significantly larger (that group also saw a much steeper decline in confidence two months ago. Despite the improvement, the six-month average gap between the two income groups remains large (lower chart). One thing you can count on, though, is that if the weakness in equities of the last couple of days persists throughout the month you can expect to see the spread in confidence between these two groups narrow as higher income consumers with more exposure to the stock market see a hit in their overall net worth,
Q1 GDP Finishes Revision Cycle At +1.1% QoQ SAAR
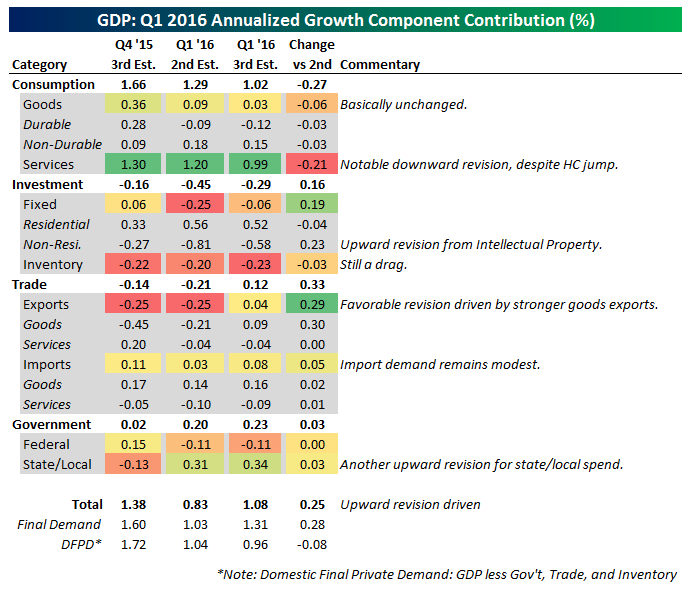
Today the BEA released its third and final estimate of Q1 2016 GDP growth. After an initial release of 0.53% QoQ SAAR, growth was ultimately revised up to +1.08% QoQ SAAR. Today’s release showed upward revisions to health care services consumption, intellectual property investment, and goods exports, with downward revisions to other services spending (driving down total consumption growth), inventories, and imports. The net results were positive, but despite a positive revision cycle Q1 US GDP growth wasn’t very impressive. It’s important to remember that declines in oil patch investment still had a massive impact. Reduced oil field investment shaved 55 bps off Q1 GDP alone (after -45 bps, -68 bps, -29 bps, and -20 bps in each quarter of 2015 respectively). And that’s only accounting for wells specifically; the pass-through of lower investment in machinery, extraction equipment, and similar spending isn’t included in that figure.
The good news is that the slowdown in growth in Q1 looks unlikely to continue. While Q2 isn’t setting up for massive jumps in output, both the Atlanta Fed’s GDPNow tracker and the New York Fed’s Nowcast model suggest a rebound. As shown below, the widely-cited Atlanta Fed model for GDP forecasting is quite accurate at predicting the initial GDP print, but it’s not able to take into account new information over time that leads to upward revisions of Final GDP like those we saw this quarter. The same would be true for downward revisions. So while growth should have a decent 2-handle in Q2, the cows are certainly not in the barn yet!
![]()
Dynamic Upgrades/Downgrades: 6/28/16
Getting Extreme Oversold Readings Quickly
 After closing at overbought levels on Thursday afternoon, the bottom has fallen out of US equities. What makes the moves even more extraordinary is that the move in US equities has been tame compared to what we have seen in other global markets. Through Monday’s close, the S&P 500 is now more than three standard deviations below its 50-DMA and at its most oversold level since January. The graphic to the right shows the current levels of the S&P 500 and each of its ten sectors relative to their 50-DMA. Along with the S&P 500, four sectors (Consumer Discretionary, Financials, Industrials, and Materials) are also trading more than three standard deviations below their 50-DMAs. At the same time, Telecom Service and Utilities are trading at overbought levels!
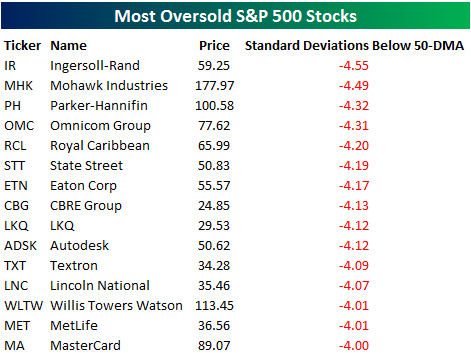
As you might guess, with the market so oversold, plenty of stocks are trading at oversold levels as well. In fact, 295 stocks in the S&P 500 closed in oversold territory on Monday, which is the highest reading since 2/11 and up from just 36 on Thursday’s close. To put that increase in perspective, going back to 2007, there hasn’t been a single time where the number of oversold stocks increased by that much in the span of two trading days! Finally, among those 295 oversold stocks in the S&P 500, 15 closed four or more standard deviations below their 50-DMAs on Monday (see table below). To put that in perspective, it’s pretty uncommon to see one stock trading at that oversold of a level let alone 15!
The Closer 6/27/16 – “The Big VIX-Connect”
Looking for deeper insight on global markets and economics? In tonight’s Closer sent to Bespoke clients, we dive into the big disconnect between stocks and volatility. We also take a look at the Advance Manufacturers’ Sales, Orders, and Inventories report which was released Friday.

The Closer is one of our most popular reports, and you can sign up for a trial below to see it and everything else Bespoke publishes free for the next two weeks!
Click here to start your no-obligation free Bespoke research trial now!
ETF Trends: Hedge – 6/27/16
Below is our daily list of the twenty best and twenty worst performing ETFs over the last five trading days. The markets continued to reel from the after-shocks of Brexit. A large group of European exposures continued to tank, as did, unsurprisingly, the British pound. Peripheral Europe and banking related stocks have been especially hard hit. Gold exposures were again the winner of the chaotic day. Treasuries and other low-risk bonds also performed strongly.

Bespoke provides Bespoke Premium and Bespoke Institutional members with a daily ETF Trends report that highlights proprietary trend and timing scores for more than 200 widely followed ETFs across all asset classes. If you’re an ETF investor, this daily report is perfect. Sign up below to access today’s ETF Trends report.
See Bespoke’s full daily ETF Trends report by starting a no-obligation free trial to our premium research. Click here to sign up with just your name and email address.