Jobless Claims Slightly Higher; 69 Weeks Below 300K
This week’s jobless claims report was pretty uneventful, with the reported number coming in at 268K (1K above consensus estimates), representing an increase of 10K from last week. While the actual move in claims was minimal, it did represent the 69th straight week that claims were below 300K. That’s the longest streak since 1973, and if we go another five weeks below 300K it will be the longest streak since 1970.
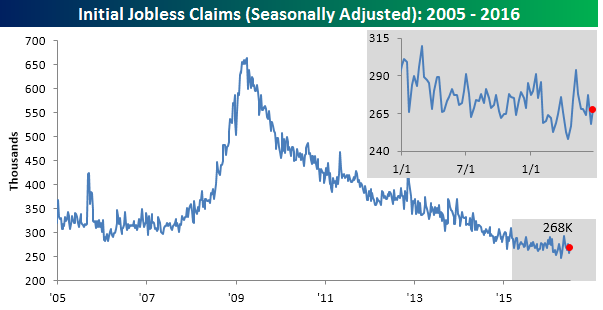
Due to the fact that this week’s reading was the same as the level we dropped from five weeks ago, the four-week moving average remained unchanged at 266.75K. This is just over 10K above the cycle low of 256K from ten weeks ago.

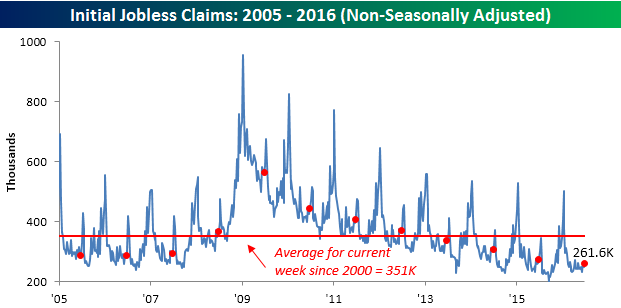
On a non-seasonally adjusted (NSA) basis, claims increased by 13K up to 261.6K. For the current week of the year, this is the lowest reading in NSA claims since 1973 and 90K below the average for the current week of the year dating back to 2000.
The Closer 6/29/16 – “UK Stocks Optimistic? Not So Much.”
Looking for deeper insight on global markets and economics? In tonight’s Closer sent to Bespoke clients, we evaluate the economic signals being sent by UK stocks. We also take a look at US economic data, including a very strong ATA Truck tonnage reading released earlier this week (chart below), DoE/EIA petroleum data, and the Personal Income and Spending Report today. We finish up with a summary of the busy slate for overnight economic data and events.

The Closer is one of our most popular reports, and you can sign up for a trial below to see it and everything else Bespoke publishes free for the next two weeks!
Click here to start your no-obligation free Bespoke research trial now!
ETF Trends: International – 6/29/16
Gold and Treasuries continue to outperform on a five day basis despite a painful selloff into the close of US equity markets for bonds today. We’ve seen large bounces in European equity markets over the last couple of days, but that hasn’t helped recoup most of the grim losses following the UK’s referendum vote last week. A sneaky strong performer has been natural gas with silver, TIPS, and other inflation proxies also doing quite well.

Bespoke provides Bespoke Premium and Bespoke Institutional members with a daily ETF Trends report that highlights proprietary trend and timing scores for more than 200 widely followed ETFs across all asset classes. If you’re an ETF investor, this daily report is perfect. Sign up below to access today’s ETF Trends report.
See Bespoke’s full daily ETF Trends report by starting a no-obligation free trial to our premium research. Click here to sign up with just your name and email address.
Chart of the Day: Average Stock Returns Post Brexit: Domestics Win!
After a bloodbath in equities Friday and Monday, US stocks have come roaring back in the last two trading days to help stem some of the initial losses in the wake of Thursday’s UK referendum vote. Since the close on 6/23, the S&P 500 is now down just 2%, while the average return of the 500 stocks in the index is a bit worse at –2.91%. In today’s Chart of the Day, we take a look at the individual returns of the stocks in the S&P 500 including a look at what key traits are shared by the 20 biggest winners.
Bespoke CNBC Appearance (6/29)
Bespoke’s Paul Hickey appeared on CNBC’s Squawk Box earlier this morning to discuss the longer term impact of the Brexit vote on financial markets. To view the segment, please click on the image below.

;
Crude Oil Remains Firm
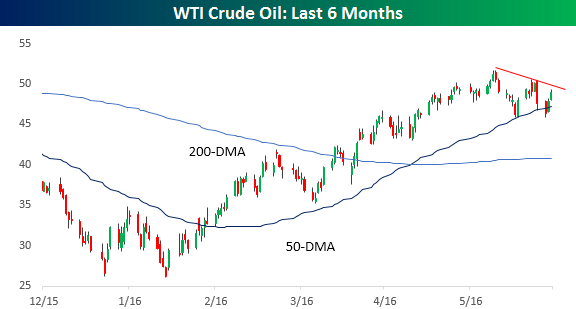
In light of the global economic uncertainty that arose out of the Brexit vote last week, the fact that crude oil currently trades within 5% of its recent highs is pretty impressive. Add to that the fact that crude has remained firm despite the strength in the dollar, and it only reinforces the resilience that the commodity has shown. That being said, the chart does show a bit of a downtrend in the very short run, so either crude will hold its 50-DMA and make a higher high or the 50-DMA will fold under pressure. Whatever the resolution, we should find out in the coming days.
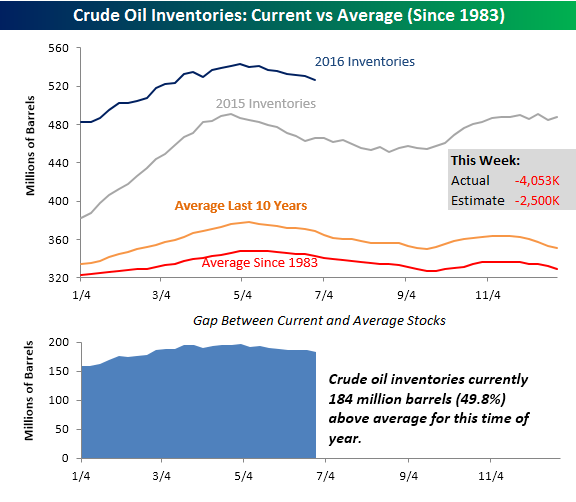
One thing working in crude’s favor is the fact that inventories have been declining and following the script of their typical seasonal pattern. According to this week’s inventory report from the DoE, crude oil inventories fell by 4.053 mln barrels compared to estimates for a decline of just 2.5 mln barrels. It was also the sixth straight week that inventory levels declined on a week to week basis. The chart below shows historical crude oil inventory levels by week for 2015 and 2016 as well as the average going back to 1983 and the last ten years. While stockpiles are well above average no matter how you look at it, we would note that based on current levels they are now 49.8% above their historical average for this time of year. That’s still a huge difference, but earlier this year inventories were nearly 54% above their historical seasonal levels. You have to start somewhere, and the current declines in excess inventories are a step in the right direction for crude bulls.
;
Gas Prices Beginning Their Seasonal Decline
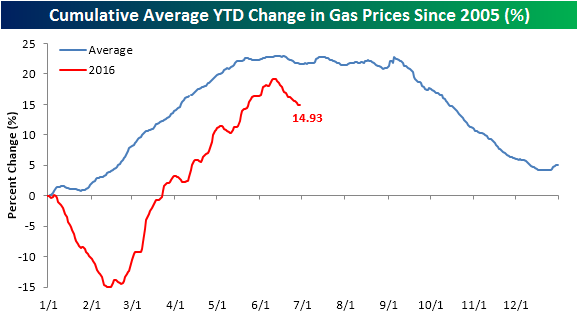
 According to AAA, 46 million Americans will either hop in a car, plane, train, or boat this July 4th weekend, and while gas prices are up on the year, relative to prior July 4th weekends they haven’t been this low in over a decade. The table to the right shows the YTD change for the national average price of a gallon of gas as of 6/29 along with the YTD change. At a national average price of $2.294 per gallon, prices are up 14.9%. While that’s the largest YTD change in five years, because prices are coming off such a low base the absolute price remains low.
The chart below shows a composite chart of the national average YTD change in price of a gallon of gas going back to 2005 compared to this year. While this year started off on a weak note, beginning in February, prices started to follow their seasonal trend and rallied right through the beginning of June. While prices were up nearly 20% on the year at one point, following the recent pullback the YTD gain has pulled back to less than 15%. If the pattern continues to gold going forward, prices have likely peaked for the year and should trade in a sideways range for the remainder of the summer, and then start their seasonal decline after Labor Day weekend.
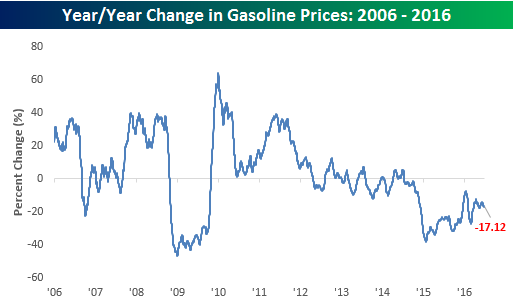
The final chart we wanted to show is the y/y change in gasoline prices going back to 2006. Even after the nearly 15% increase in prices at the pump this year, the national average price is still down over 17% y/y. While the magnitude of the y/y decline has moderated recently, what is most noteworthy about this chart is the fact that prices have been down on a y/y basis for nearly two years now. When you start compounding y/y declines, it really starts to add up!
;
Dynamic Upgrades/Downgrades: 6/29/16
The Closer 6/28/16 – “‘Tis Only A Flesh Wound”
Looking for deeper insight on global markets and economics? In tonight’s Closer sent to Bespoke clients, we take a look at cross-asset signals around whether this was the bottom for equities. We also review a series of economic data released today.
The Closer is one of our most popular reports, and you can sign up for a trial below to see it and everything else Bespoke publishes free for the next two weeks!
Click here to start your no-obligation free Bespoke research trial now!
ETF Trends: US Sectors & Groups – 6/28/16
Below is our daily list of the twenty best and twenty worst performing ETFs over the last five trading days. While most assets that took a hit over the last few sessions bounced today, on a 5-day look back European ETFs continue to hurt, filling up the majority of our worst performer list. Banks and Capital Markets were the only non- regional/country based exposure or exchange to rank among the worst performers. As in prior days, gold and US treasuries and bonds were the winners, though gains were reversed to some degree on a one-day basis.
Bespoke provides Bespoke Premium and Bespoke Institutional members with a daily ETF Trends report that highlights proprietary trend and timing scores for more than 200 widely followed ETFs across all asset classes. If you’re an ETF investor, this daily report is perfect. Sign up below to access today’s ETF Trends report.
See Bespoke’s full daily ETF Trends report by starting a no-obligation free trial to our premium research. Click here to sign up with just your name and email address.