S&P 500 Market Cap and Equal-weighted Indices Near All Time Highs
As mentioned in an earlier tweet, the S&P 500 is going to take it right down to the wire regarding whether it can close at a new all-time high or not, and extend the length of the bull market putting it into number two all time. With a half hour left in the session and the week, the S&P 500 trades within 0.5% of an all-time high and less than a point from a new closing high.

In terms of participation, strength has been pretty broad based. The chart below shows the S&P 500 Equal-weighted index going back to 5/21/15 as well. Under the method of giving each stock an equal weight in terms of performance, the S&P 500 still has further to go than the market cap weighted index before taking out its all-time high (1.7%) and has yet to even take out its high from early June. That said, while a modest disparity between the two exists, at this point it hardly fits the standard of egregious.

S&P 500 Weekly Chart Book: 7/8/16
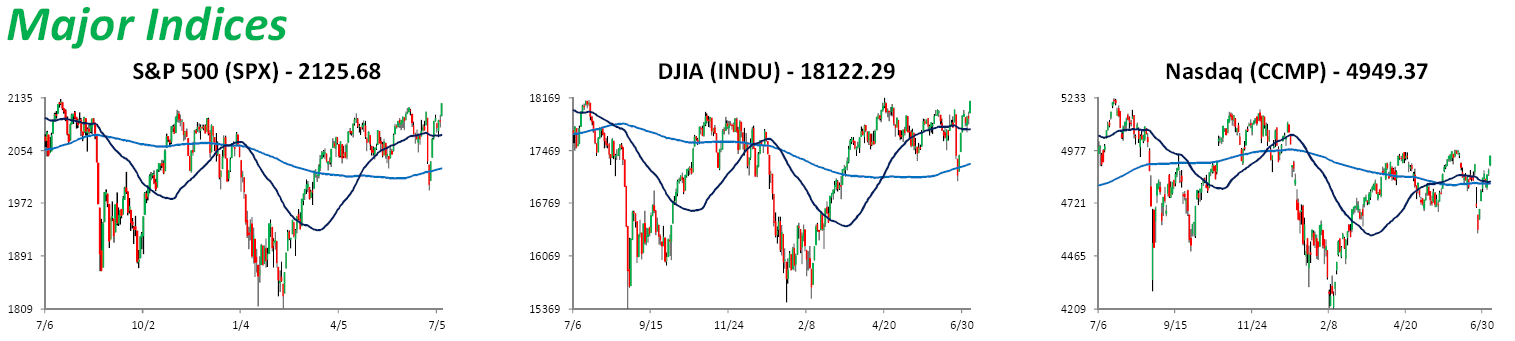
Friday’s stronger than expected jobs report sent stocks shooting higher and the S&P 500 within spitting distance of a new all-time high. The DJIA is also close to new highs, while the Nasdaq still has a way to go. Will this be the rally that finally pushes the S&P 500 to a new high? Only time will tell, but looking at the charts of the stocks that make up the S&P 500 should help you navigate which sectors of the market are leading the way higher, so check out our S&P 500 Weekly Chart Book.
Bespoke provides Bespoke Premium and Bespoke Institutional members with its S&P 500 Weekly Chart Book, which contains one-year price and volume charts of every stock in the S&P 500 grouped by sector. Whether you have five minutes or an hour, if you follow the charts, there is no faster way to get a read on which areas of the market are working and which are not.
See Bespoke’s S&P 500 Weekly Chart Book by starting a no-obligation free trial to our premium research. Click here to sign up with just your name and email address.
ETF Trends: Fixed Income, Currencies, and Commodities – 7/8/16
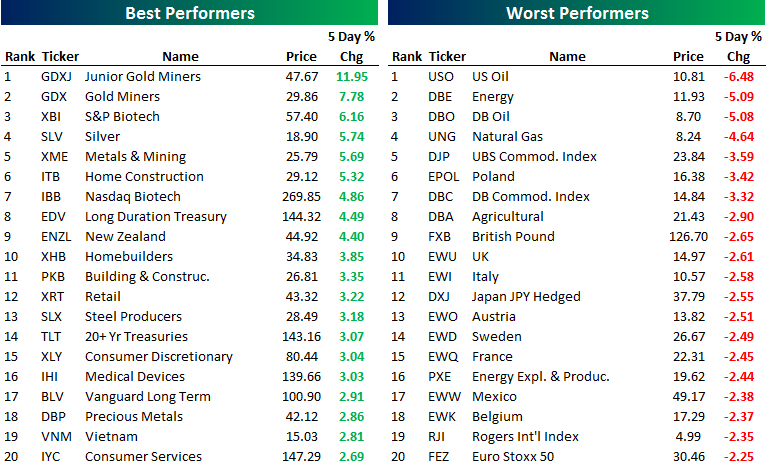
Below is our daily list of the twenty best and twenty worst performing ETFs over the last five trading days. The top performing gold and silver exposures that were mining related inched up again today to remain high on the list, but several other gold exposures slipped out of the top 20. Home building and construction stocks also continued to rise. Oil and natural gas prices were fairly stable as compared to yesterday but were still among the worst performing stocks of the week. Consumer discretionary and retail also appeared on the top performer list for the first time in a while, as the strong jobs report bodes well for consumer sentiment.
Bespoke provides Bespoke Premium and Bespoke Institutional members with a daily ETF Trends report that highlights proprietary trend and timing scores for more than 200 widely followed ETFs across all asset classes. If you’re an ETF investor, this daily report is perfect. Sign up below to access today’s ETF Trends report.
See Bespoke’s full daily ETF Trends report by starting a no-obligation free trial to our premium research. Click here to sign up with just your name and email address.
Chart of the Day – 25th Time the Charm?
B.I.G. Tips – Strongest Headline Non Farm Payrolls Prints Relative to Expectations
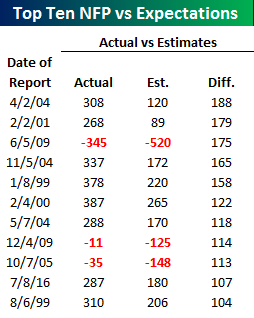 After an abysmal headline Non-Farm Payrolls (NFP) report for May, June saw a complete 180-degree turn with this morning’s reported reading for total non-farm payrolls coming in at 287K compared to expectations for a gain of 180K. That beat of 107K qualifies as the best headline print relative to expectations since December 2009 (November 2009 report), and based on our Economic Indicator Database, the 10th best report relative to expectations since 1998. The table to the right lists each of the ten prior NFP reports where the initial print exceeded consensus estimates by the widest margin.
In a B.I.G. Tips report just sent to Bespoke Premium and Bespoke Institutional members, we provided an analysis of the S&P 500’s performance on each of these prior ten days. Read the full report by signing up.
See the full B.I.G. Tips report by signing up for a monthly Bespoke Premium membership now. Click this link for a 10% discount ($89/month).
ETF Trends: International – 7/7/16
Below is our daily list of the twenty best and twenty worst performing ETFs over the last five trading days. Gold and silver slipped a bit since yesterday, but they still remain the top performers over the past five days. Construction and home-building stocks inched up slightly from yesterday. Energy and commodities were the big losers, continuing to lose ground. Oil exposures, in particular, saw the biggest declines on the day. The British pound and Japanese Hedged continued to creep down.

Bespoke provides Bespoke Premium and Bespoke Institutional members with a daily ETF Trends report that highlights proprietary trend and timing scores for more than 200 widely followed ETFs across all asset classes. If you’re an ETF investor, this daily report is perfect. Sign up below to access today’s ETF Trends report.
See Bespoke’s full daily ETF Trends report by starting a no-obligation free trial to our premium research. Click here to sign up with just your name and email address.
Chart of the Day – Sector Dividend Yields Relative to Recent History
B.I.G. Tips – June Employment Report Preview
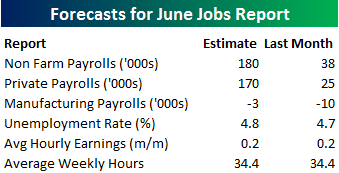
Heading into tomorrow’s Non Farm Payrolls (NFP) report for June, economists are expecting an increase in payrolls of 180K, which would be a big increase from last month’s extremely disappointing level of 38K. In the private sector, economists are expecting an increase of 170K, which would be a similar improvement to what economists are forecasting for the overall NFP reading. The unemployment rate is forecasted to increase back up to 4.8% from 4.7% last month. Growth in average hourly earnings is expected to remain unchanged at 0.2%, while hours worked is forecast to remain unchanged at 34.4. May’s employment report was a big disappointment for the market and economists, but economists are generally considering it to be a one month blip.
In a report sent to Bespoke Premium and Bespoke Institutional clients today, we provided the historical performance of the S&P 500, sectors, individual stocks on the day of NFP reports over the last two years. To see the report, please sign up for a monthly Bespoke Premium membership below!
See the full B.I.G. Tips report by signing up for a monthly Bespoke Premium membership now. Click this link for a 10% discount ($89/month).
Bespoke’s Sector Snapshot — 7/7/16
We’ve just released our weekly Sector Snapshot report (see a sample here) for Bespoke Premium and Bespoke Institutional members. Please log-in here to view the report if you’re already a member. If you’re not yet a subscriber and would like to see the report, please start a 14-day trial to Bespoke Premium now.
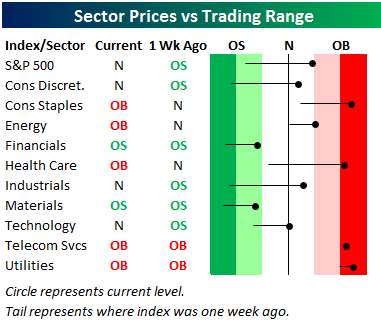
Below is our trading range screen of the S&P 500 and its ten sectors. For each sector, the dot represents where it’s currently trading within its range, while the tail end represents where it was trading one week ago. Moves into the red zone are considered “overbought,” while moves into the green zone are considered “oversold.”
The black vertical “N” line in the screen represents each sector’s 50-day moving average. Last week at this time, the S&P 500 and five of ten sectors were trading in oversold territory, while just two sectors — Materials and Financials — are oversold as of today.
To see our full Sector Snapshot with additional commentary plus six pages of charts that include analysis of valuations, breadth, technicals, and relative strength, start a 14-day free trial to our Bespoke Premium package now. Here’s a breakdown of the products you’ll receive.
Individual Investors Look Beyond Brexit
Investor sentiment from the American Association of Individual Investors (AAII) was released earlier today and showed that bullish sentiment increased for the second straight week to 31.1%, That’s the highest reading since late April. What’s noteworthy about this increase is that ever since Brexit, bullish sentiment has increased. True, there is still a way to go before this measure even gets back to average levels, as bullish sentiment has been below 40% for 36 straight weeks. Unlike many in the investment community, the ‘little guy’ definitely doesn’t appear to be freaking out about Brexit.
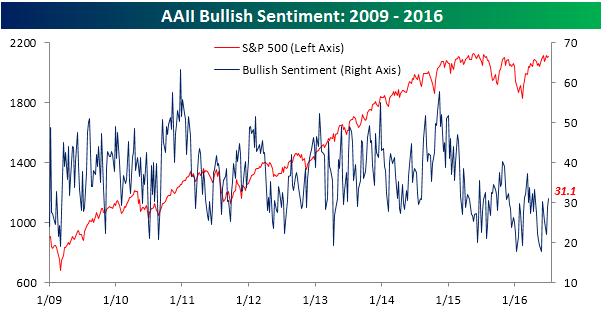
While bullish sentiment increased, bearish sentiment saw an even larger decline in magnitude. From last week’s level of 33.42%, bearish sentiment declined to 26.7%, making this the largest weekly decline since February.
