Headline Philly Fed Misses Expectations
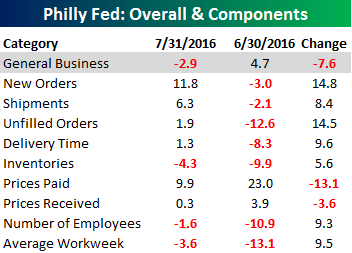 Manufacturing in the Philadelphia region unexpectedly weakened in the month of July as the Philly Fed report turned negative and missed expectations. While economists were forecasting a headline reading in the General Business Conditions Index of 4.5, the actual reading came in at -2.9, which was the lowest headline reading since January. Looking at the internals of the report, though, the picture was much less negative. As shown in the table to the right, the majority of components in the report were positive and showed improvement relative to June. New Orders, for example, saw a big jump, rising from -3.0 up to 11.8. The only three components that were negative this month were Inventories, Number of Employees, and Average Workweek, but even with the negative readings, all three showed improvement.

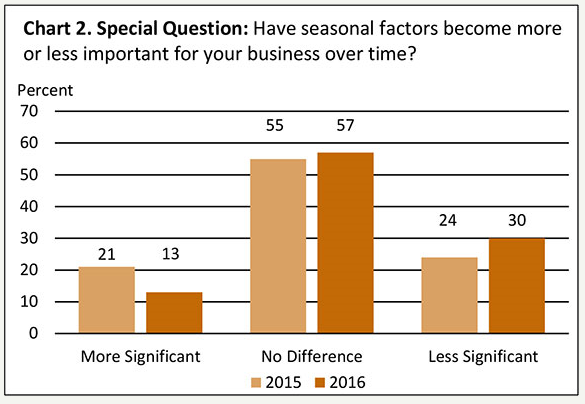 One interesting aspect of this month’s report was a special question that the Philadelphia Fed asked respondents about seasonal factors and how they impact their business. There have been numerous times in the past few years where we have seen economic reports that either beat or wildly miss consensus expectations, and the culprit often cited is that seasonal adjustments skewed the results. This month’s special question suggests that seasonal factors may be less impactful to businesses than they have been in the past and would confirm that seasonal adjustments based on historical patterns may no longer be as applicable. As shown in the chart at right, when asked, “Have seasonal factors become more or less important for your business over time?”, the percentage of businesses that said “more significant” dropped from 21% down to 13%, while the percentage that said “less significant” increased from 24% up to 30%. This is just one data point in one region of the country, but it’s something to think about.
Jobless Claims Continue Their Amazing Run
This week’s report on jobless claims came in lower than expected with another impressive reading. While economists were forecasting first-time claims to come in at a level of 265K, the actual reading came in 12K lower at 253K. This was the lowest weekly reading since April and is tied for the second lowest weekly reading of the current cycle. Just when you think claims have to start levelling off or rising, they start falling again!
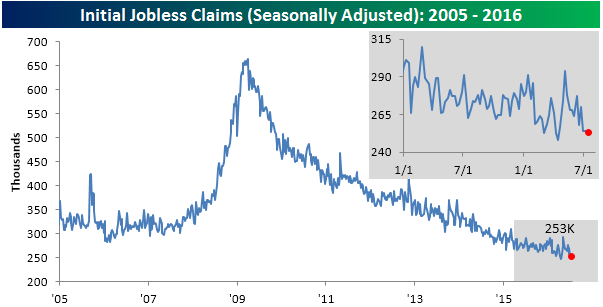
With three straight weeks of sub-260K readings, the four-week moving average is now within 2K of its multi-decade low of 256K. We thought it was extraordinary enough that the four-week moving average dropped as low as 256K back in April in the first place, but we honestly never thought it would get back down towards those levels again. If we see another reading like the last three next weeks, the four-week moving average will set another cycle low next week.

On a non-seasonally adjusted (NSA) basis, jobless claims came in at 269.2K. While we are used to noting that the weekly NSA reading is the lowest for the current week of the year going back to the early 1970s, this week’s reading was actually slightly higher than the same week last year. Relative to readings for the current week of the year dating back to 2000, though, this week’s level was nearly 150K below the 415K average, so it was hardly weak.
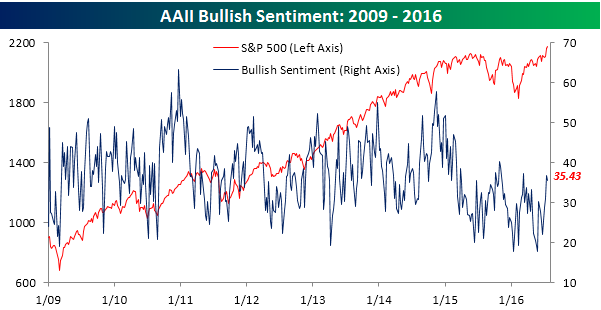
Bullish Sentiment Remains Below Average
Despite the continued underlying bid in equities, individual investors still can’t get over the hump and push bullish sentiment back up above 40%. According to this week’s sentiment survey from AAII, bullish sentiment declined slightly, falling from 36.9% down to 35.4%. That makes this the 38th straight week where bullish sentiment has been below 40% and the 72nd time in the last 73 weeks that we have seen sub 40% levels of bullish sentiment.
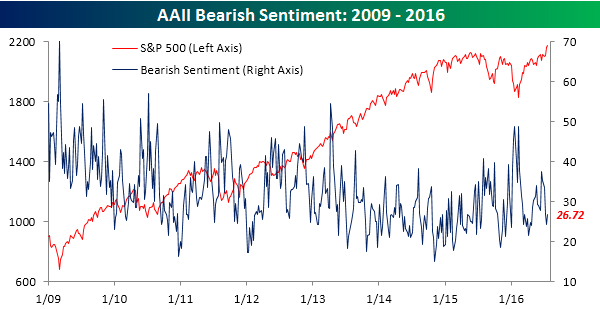
Bearish sentiment saw a modest uptick this week, rising from 24.4% to 26.7%. With stocks sitting comfortably at all-time highs, the fact that one-quarter of individual investors consider themselves bearish shows a general lack of complacency.
The Closer 7/20/16 – The Fund Effect As VIX Veers
Looking for deeper insight on global markets and economics? In tonight’s Closer sent to Bespoke clients, we take a look at some turbulence in short-term interest rate markets driven, in our view, by regulatory reforms. We also continue to look at the VIX which made new lows today below 12.

The Closer is one of our most popular reports, and you can sign up for a trial below to see it and everything else Bespoke publishes free for the next two weeks!
Click here to start your no-obligation free Bespoke research trial now!
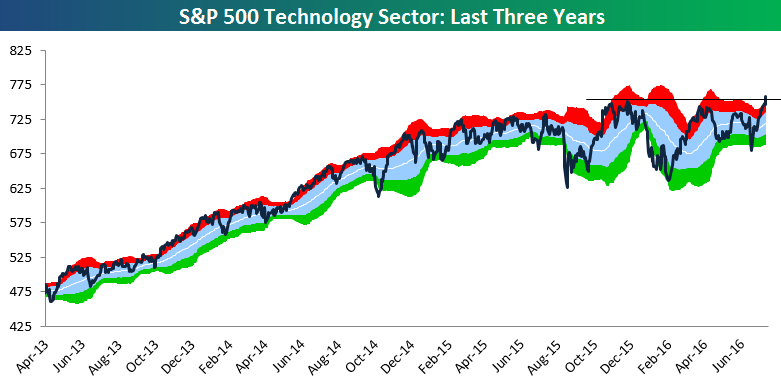
New High for Tech Sector
The S&P 500 Technology sector has a weighting of more than 20% in the S&P 500. If Tech is performing well, it’s likely that the broad market is performing well too. Over the last few weeks, Tech has led this market higher, and today the sector became the second cyclical sector — along with Industrials — to make a new bull market high. While it’s just one day still, this breakout to new highs for Tech is a positive for the market.
Fixed Income Weekly – 7/20/16
Searching for ways to better understand the fixed income space or looking for actionable ideals in this asset class? Bespoke’s Fixed Income Weekly provides an update on rates and credit every Wednesday. We start off with a fresh piece of analysis driven by what’s in the headlines or driving the market in a given week. We then provide charts of how US Treasury futures and rates are trading, before moving on to a summary of recent fixed income ETF performance, short-term interest rates including money market funds, and a trade idea. We summarize changes and recent developments for a variety of yield curves (UST, bund, Eurodollar, US breakeven inflation and Bespoke’s Global Yield Curve) before finishing with a review of recent UST yield curve changes, spread changes for major credit products and international bonds, and 1 year return profiles for a cross section of the fixed income world.
This week, we took a look at which OIS forwards were most influential for the ten year US Treasury yield. We then looked at how the current Fed policy stance via forward guidance may be impacting the benchmark long-term bond yield. Our fixed income ETF spotlight this week focuses on income generation.
Our Fixed Income Weekly helps investors stay on top of fixed income markets and gain new perspective on the developments in interest rates. You can sign up for a Bespoke research trial below to see this week’s report and everything else Bespoke publishes free for the next two weeks!
Click here to start your no-obligation free Bespoke research trial now!
ETF Trends: US Sectors & Groups – 7/20/16
Below is our daily list of the twenty best and twenty worst performing ETFs over the last five trading days. The Turkish ETF continued to drop amidst uncertainty after the failed coup, maintaining its grip on the worst performer of the week. Gold exposures had a significant single day drop to render them all among the bottom 20 ETFs for the week, largely replacing the oil exposures which made modest gains today to drop off the list of bottom performers. Brazil and semiconductors were both up again, trading places for the top two spots. The biotech stocks also surged on the day.

Bespoke provides Bespoke Premium and Bespoke Institutional members with a daily ETF Trends report that highlights proprietary trend and timing scores for more than 200 widely followed ETFs across all asset classes. If you’re an ETF investor, this daily report is perfect. Sign up below to access today’s ETF Trends report.
See Bespoke’s full daily ETF Trends report by starting a no-obligation free trial to our premium research. Click here to sign up with just your name and email address.
Chart of the Day: VIX Below 12
The VIX Volatility index, otherwise known as the “fear gauge,” closed below 12 yesterday for the first time in just over a year. Below is a chart of the VIX going back to 1990, with green shading denoting sub-12 levels.

In today’s Chart of the Day sent to paid subscribers, we analyzed historically low readings for the VIX and how the equity market typically performs during these periods and beyond. Sign up for a free Bespoke research trial below to view today’s Chart of the Day.
B.I.G. Tips – The Bespoke Death By Amazon Indices Update 7/20/16
Election Odds: Trump Tops 30%
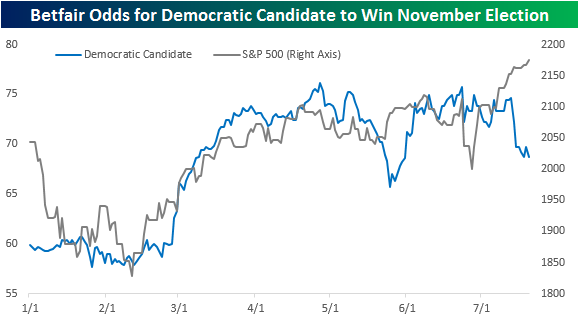
With the Republican National Convention fully underway, Donald Trump has seen quite a bounce in the betting markets regarding his chances of winning the November election. In the latest odds from the betting markets, Trump’s odds surpassed 30% for just the second time since he announced his candidacy over a year ago. At a level of 30.1%, his current odds are within one percentage point of his late May high (30.8%), when he all but locked up the nomination.
Oil tycoon Harold Hamm has chalked up the recent rally in equities to what he says is the market’s realization that, if elected, Donald Trump will be more friendly towards business. Whether you agree with his notion or not, there can be a case made that while the performance of equities had been closely tracking the poll numbers of Hillary Clinton, more recently, it has been Trump’s poll numbers that stocks have tracked.

Meanwhile, as the S&P 500 has surged, Clinton’s poll numbers have declined to their lowest level since late May. We have repeatedly highlighted the fact that history shows that equity markets have tended to do better under the administrations of Democratic presidents, but in the short term at least, Trump’s improving poll numbers have had zero impact on equity prices. That lack of a reaction may be due either to the fact that the betting markets have lost a lot of credibility post the 6/23 Brexit vote or that even after the recent shifts in the betting markets, Hillary Clinton’s chances of winning in November are still more than twice that of Donald Trump.