Chart of the Day – Slow Starts to Slow Days
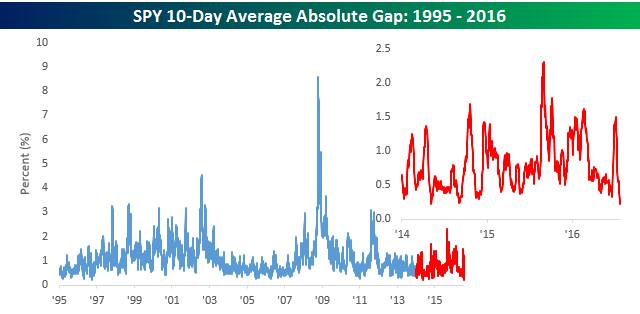
If you’re the type of person who turns on the financial news in the morning, you’ve likely noticed that on most days recently, futures have been little changed. In fact, using the S&P 500 tracking ETF (SPY) as a proxy, the S&P 500 has gapped up or down at the open by less than 0.2% for four straight days. And through yesterday, the ten-day average opening gap of SPY was a record low +/-0.215% (since 1994 when SPY started trading). To put this lack of volatility into perspective, the median opening gap for SPY going back to 1994 has been +/-0.76%!
In today’s Chart of the Day sent to paid subscribers, we look at periods where SPY had similar 10-day periods with low volatility at the opening bell and see how the market performed going forward. To view the report, please start a 14-day free trial below.
ETF Trends: US Sectors & Groups – 7/27/16
Below is our daily list of the twenty best and twenty worst performing ETFs over the last five trading days. Gold and other metals have had a solid run as have biotech names. South Africa has been the single best performer at the country level while European equity exposure has benefited from FX hedging. The worst performing ETFs have been oil and energy related, with coffee soft as well. Mexican equity have gotten hit as USDMXN has moved higher.

Bespoke provides Bespoke Premium and Bespoke Institutional members with a daily ETF Trends report that highlights proprietary trend and timing scores for more than 200 widely followed ETFs across all asset classes. If you’re an ETF investor, this daily report is perfect. Sign up below to access today’s ETF Trends report.
See Bespoke’s full daily ETF Trends report by starting a no-obligation free trial to our premium research. Click here to sign up with just your name and email address.
Trump vs. Clinton — RealClearPolitics Poll Tracking
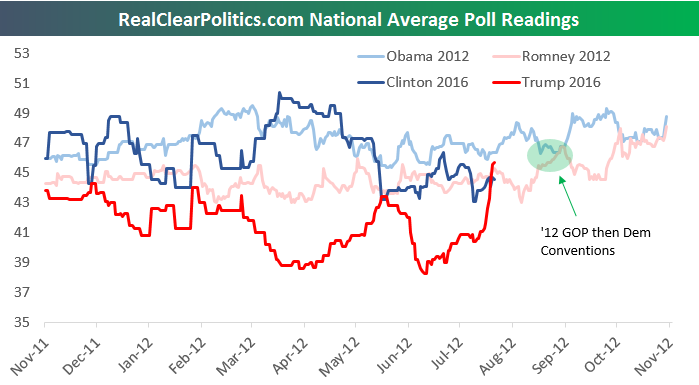
 RealClearPolitics.com (RCP) is one of the best poll aggregation sites around, and we’ve been following its national general election poll tracker for years now. The tracker simply combines a basket of national Presidential election polls to come up with an average reading for each candidate. Over the last few days, Donald Trump has moved slightly ahead of Hillary Clinton in the RCP national average general election poll. At right we have charted the RCP tracker for Trump vs. Hillary going back to November 2015. As shown, Clinton pulled away from Trump in March and April, but since then the spread has mostly been tightening. At the end of May, Trump moved slightly above Clinton for a couple of days, but then Trump saw his numbers dip to their lows of the series in mid-June. Since those lows, Trump’s numbers have been spiking, and the RCP Trump tracker is at a new high of 45.7% today. Clinton, meanwhile, saw her tracker peak at 50% on March 24th, but her numbers have been range-bound between 43% and 46% since late May.
With Trump pulling slightly ahead of Clinton, we looked back at RCP’s national average poll for the 2012 general election to see where the GOP (Romney) and Democratic (Obama) candidates stood at this point in time in the cycle. One important difference between the 2012 and 2016 elections is the date of the party conventions. The 2012 conventions came much later in the cycle. Romney’s 2012 GOP convention ran from August 27th through August 30th, while Obama’s Democratic Convention ran the following week from September 3rd through September 6th. The GOP convention this year ran from July 18th through July 21st, while the Democratic convention began on July 25th and runs through the 28th.
Below is a chart comparing Trump’s RCP national average poll reading with Romney’s in 2012. (The x-axis dates reference the 2012 election so use 2015/2016 for Trump’s reading.) If anything, Trump has been a volatile candidate, and his poll numbers bear that out! While Romney saw swings of 2-3 points for months on end leading up to the election, Trump has seen his numbers swing by 6-7 points. Right now Trump is on the upswing, though. He saw a bounce leading up to the convention and another big spike right after the convention. As of today, July 27th, Trump’s RCP average is above Romney’s average on the same date in 2012. Remember, though, that Romney’s convention wasn’t until the end of August, and he too saw a bounce of a couple points in the immediate aftermath.

The Democratic convention is ongoing, and Clinton is certainly hoping for a bounce similar to the one Trump saw. Obama, Romney and Trump all saw post-convention bounces, so the expectation is that Clinton will see one as well. Even still, at this point in the 2012 campaign, Obama’s RCP average was a couple points above where Clinton is now.

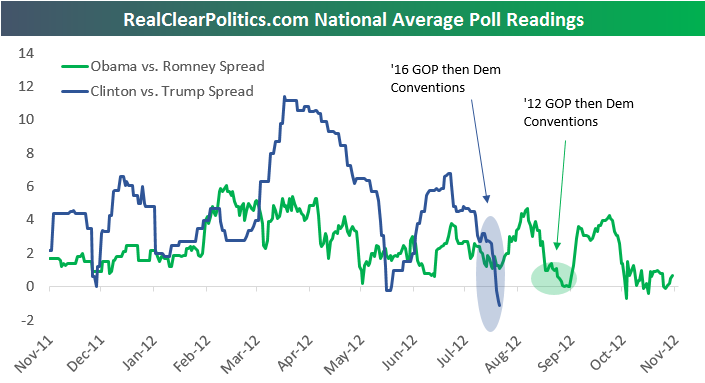
Below is a chart showing both sets of RCP average poll numbers for 2012 and 2016. The second chart shows the spread between the two candidates in each election. In the second chart, when the spread is in positive territory, it means the Democratic candidate has the lead over the GOP candidate. When the spread is in negative territory, the GOP candidate is ahead.
One thing you’ll notice in the spread chart is that Romney’s lead over Obama never got as big as the one Trump has over Clinton right now. However, the one time that Romney’s RCP average moved above Obama’s was immediately following the 2012 GOP convention. That lead evaporated the following week when the Democratic convention got underway. Will the same thing happen this time around? Only time will tell!
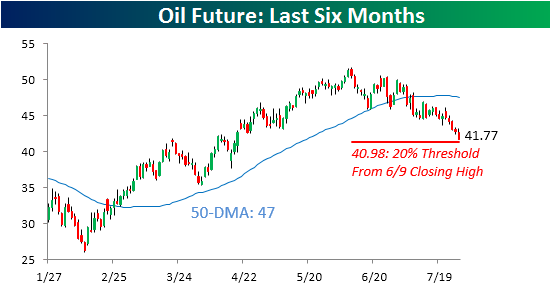
Crude Plunges Another 2%
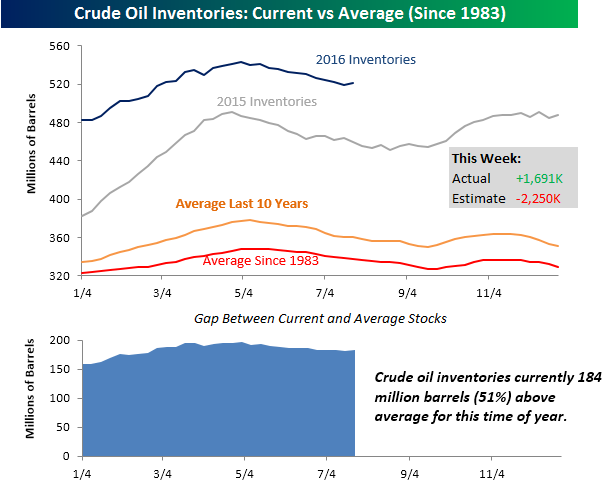
Crude oil prices dropped for a fifth straight day today, and the culprit this time around was a surprisingly large build in crude oil inventories. While traders were expecting stockpiles to decline by 2.25 million barrels, they actually increased by nearly 1.7 million barrels. As shown in the charts below, this week’s build comes at a time when stockpiles are typically in decline, although we would note that with a record nine straight weeks of inventory drawdowns, we were due for an increase. That being said, crude oil stockpiles are currently 51% above average for this time of year and with rig counts increasing, that has put some downward pressure on prices.
The pressure on prices has been especially strong in recent days. The pace of declines in crude oil has picked up steam this week, and at a current level of $41.77 is less than $1 from falling into bear market territory (20% decline from closing high of 51.23 back on 6/9).
Bespoke Short Interest Report: 7/27/16
Fixed Income Weekly – 7/27/16
Searching for ways to better understand the fixed income space or looking for actionable ideals in this asset class? Bespoke’s Fixed Income Weekly provides an update on rates and credit every Wednesday. We start off with a fresh piece of analysis driven by what’s in the headlines or driving the market in a given week. We then provide charts of how US Treasury futures and rates are trading, before moving on to a summary of recent fixed income ETF performance, short-term interest rates including money market funds, and a trade idea. We summarize changes and recent developments for a variety of yield curves (UST, bund, Eurodollar, US breakeven inflation and Bespoke’s Global Yield Curve) before finishing with a review of recent UST yield curve changes, spread changes for major credit products and international bonds, and 1 year return profiles for a cross section of the fixed income world.
This week, we investigate how carry (coupon) and roll (forward rates convergence) have changed for the US fixed income space over the past few years. Our trade idea focuses on US credit.

Our Fixed Income Weekly helps investors stay on top of fixed income markets and gain new perspective on the developments in interest rates. You can sign up for a Bespoke research trial below to see this week’s report and everything else Bespoke publishes free for the next two weeks!
Click here to start your no-obligation free Bespoke research trial now!
Dynamic Upgrades/Downgrades: 7/27/16
The Closer 7/26/16 – 4 Years Until Recession?
Looking for deeper insight on global markets and economics? In tonight’s Closer sent to Bespoke clients, we look at the yield curve. There are also four pages of charts on the Richmond Fed’s Manufacturing and Services indices, a summary of very strong New Home Sales today, and a brief preview of the FOMC meeting tomorrow.
The Closer is one of our most popular reports, and you can sign up for a trial below to see it and everything else Bespoke publishes free for the next two weeks!
Click here to start your no-obligation free Bespoke research trial now!
ETF Trends: Hedge – 7/26/16
Below is our daily list of the twenty best and twenty worst performing ETFs over the last five trading days. Oil dipped slightly, and even though gold rallied on the day, gold, oil, and commodity exposures generally were still among the worst performers on the week. Steel producers rallied from yesterday, and biotech stocks remained strong on the weak but didn’t move much today. Several China based exposure also joined the top performers, and Turkey slipped slightly after rallying yesterday. Biotech was up for the fifth straight day.
Bespoke provides Bespoke Premium and Bespoke Institutional members with a daily ETF Trends report that highlights proprietary trend and timing scores for more than 200 widely followed ETFs across all asset classes. If you’re an ETF investor, this daily report is perfect. Sign up below to access today’s ETF Trends report.
See Bespoke’s full daily ETF Trends report by starting a no-obligation free trial to our premium research. Click here to sign up with just your name and email address.
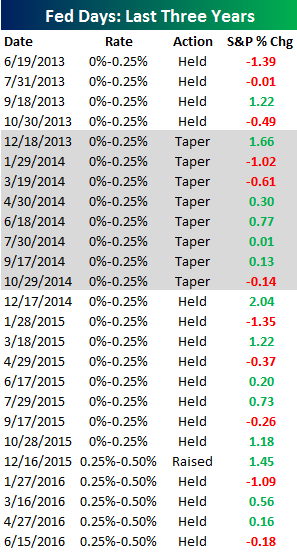
B.I.G. Tips – Fed Days – July 2016
Earlier today, we sent Bespoke Premium and Bespoke Institutional members a brand new B.I.G. Tips report looking at historical market performance on Fed Days. Below is an abbreviated version of a table from the report that shows Fed Days over the last three years. You’d be amazed to see how the S&P 500 has done on Fed Days over the last 20 years. To see the stats, get signed up for a new Bespoke membership below!
See the full B.I.G. Tips report by signing up for a monthly Bespoke Premium membership now. Click this link for a 10% discount ($89/month).