Chart of the Day: Brexcuses Brexcuses
Earlier today on Twitter, we asked people which S&P 500 company they thought had the most mentions of the term Brexit in their quarterly earnings conference call. The answer to that question was Goldman Sachs (GS), where the term was mentioned 22 times during its call! In today’s Chart of the Day sent to paid subscribers, we provided a summary of S&P 500 companies that have mentioned the term Brexit in their earnings conference calls grouped according to sector. As you might imagine, companies from some sectors made numerous mentions of Brexit in their conference calls, while among companies in other sectors, it was barely mentioned. To see the results of our analysis in today’s Chart of the Day, please start a 14-day free trial below.
Bespoke’s Consumer Pulse Report – 7/29/16
You do not currently have access to this report. Sign up for a 30-day free trial to our Pulse add-on service here.
Crude Catches a Bounce Out of Bear Territory
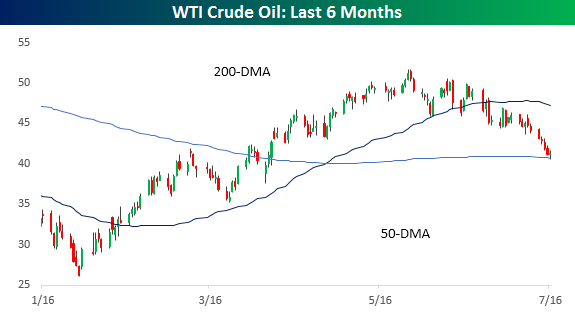
After briefly touching bear market territory earlier in the session, crude oil prices have caught a bounce intraday, taking WTI out of bear market territory (20% decline from closing high of $51.23). Despite the bounce, though, crude oil is still down 19.5% from its 2016 high, so it’s still very close to entering a new bear.
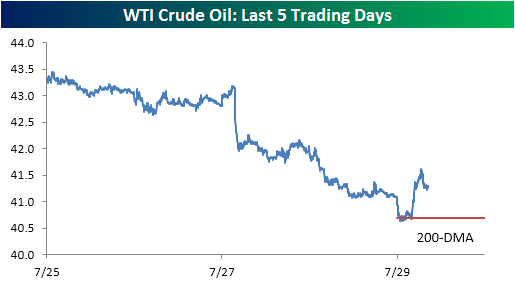
Taking a closer look at trading in crude oil this week, below we show an intraday chart over the last five days. In this chart, you can clearly see that today’s bounce (which is the biggest bounce we have seen all week) came just as prices touched on their 200-DMA as buyers stepped in at support. Now, can the bounce hold?
B.I.G. Tips – August 2016 Seasonality and Market Calendar
GDP Disappoints, But Internals Were Quite Strong
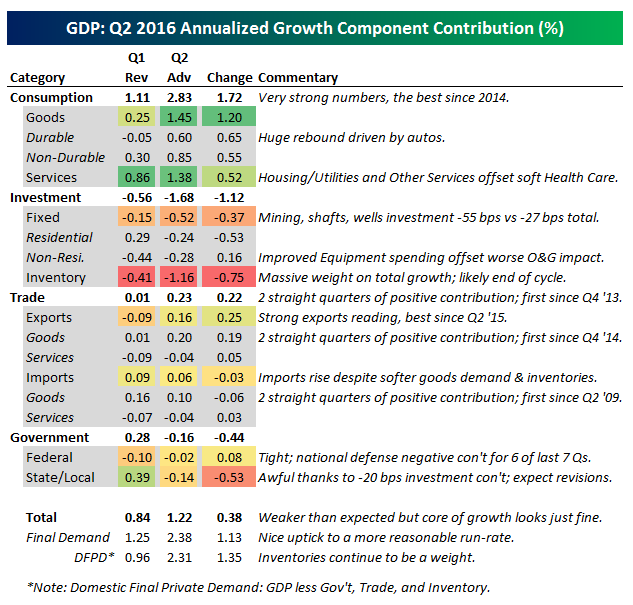
As we noted in our previous post on GDP this morning, headline GDP has been extremely disappointing versus expectations for the last two years. Even the normally very accurate Atlanta Fed’s GDPNow tracker missed today’s Advance GDP reading from the BEA by a mile. GDP grew 1.22% QoQ SAAR in Q2, versus 2.4% expected from Wall Street economists and 1.8% on the GDPNow tracker.
The guts of the report have some results that were expected, and some that were not. Consumption surged to the highest growth rate since 2014 in Q2, adding over 2.8% to total growth in the quarter. That’s a significant ramp from Q1, with autos and Housing/Utilities as well as Other Services pushing the figure up. Health Care spending softened. It’s also worth noting health care services inflation as measured by PCE is up 1.03% YoY versus 1.59% for core PCE in aggregate; in other words, slow health care inflation is pushing down inflation, contrary to the broad narratives on inflationary forces within the sector. Other components were much less strong than consumption.
Investment plunged, mostly due to a collapse in inventories. Nominal inventory/sales ratios for private industries and nonfarm inventories are at their lowest levels since Q2 2004 and Q4 2003, respectively, while real inventory/sales ratios of those two series both fell for the first time since Q3 2014. In short, there isn’t a lot of room for inventories to fall much further from the levels where they currently sit across the whole economy. There have also been 5 straight quarters of negative inventory impact on GDP averaging 60 bps per quarter. As always, inventories are a temporary headwind/tailwind for GDP, and it’s hard to envision the current -1.16% impact on growth continuing at anything close to the same pace over the next couple of years. Nonresidential investment improved versus Q1, but was still a headwind of 28 bps, while residential investment unexpectedly hit GDP by 24 bps. With new home sales accelerating to new post-recession highs in June and strong single family building activity, we don’t believe it’s possible for this series to continue dragging down GDP. Oil & gas continued to weigh on GDP.
Trade was possibly the most interesting point in the report. In Q1 and Q2 goods imports, goods exports, and total trade all made positive contributions to growth. As noted in the table below, occurrences where all three have had a positive contribution have been infrequent. We note that with inventories declining and real final sales strong, imports did not spike; the inventory supply chain is not extremely strong. We also note that solid real goods export growth suggests a slightly better global demand picture than we had previously been lead to believe.
Finally, government spending was extremely weak this quarter, especially versus Q1. Federal government expenditures have now been a headwind for growth for two straight quarters though that gap shrunk slightly this quarter. National defense has been a negative contributor for almost two years straight! Meanwhile, state and local governments unwound strong spending last quarter with a -20 bps investment contribution alone as outlays on infrastructure declined. In our view, that’s completely unsustainable and will likely be revised away. Other sections of the report that seem to be prime candidates for revision include residential investment, services consumption, inventories, and imports.
Don’t follow @bespokeinvest on Twitter yet? Below we’ve included our tweets with snap reaction to the GDP report today. Make sure to follow us for real-time updates on economic data and market action as it unfolds!
Dynamic Upgrades/Downgrades: 7/29/16
Uncanny Consistency (To the Downside) In GDP
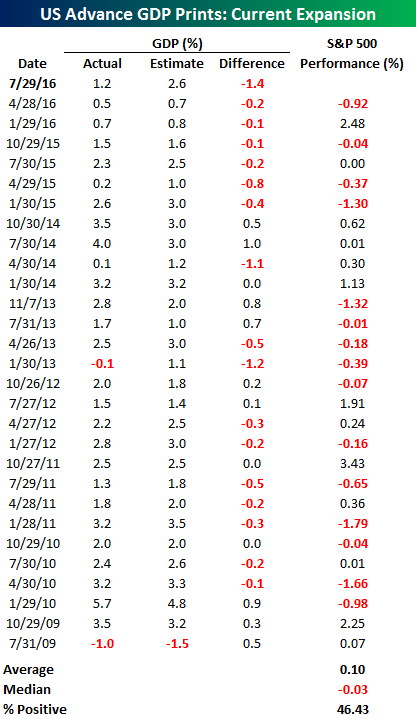 Today’s Advance GDP for the second quarter came in weaker than expected at less than half of the consensus forecast (1.2% vs 2.6%). If you follow how economic data regularly comes in relative to expectations, today’s weaker than expected print should come as no surprise. The table to the right is from our Economic Indicator Database and shows the actual (unrevised) versus estimated Advance GDP print for every quarter of the current economic expansion. As shown in the table, Friday morning’s GDP print was the seventh straight weaker than expected report. In other words, the last time one of these reports surpassed expectations was in October 2014.
Overall, the record for Advance GDP prints during the current recovery isn’t much better. In the 29 quarterly Advance GDP reports since the second half of 2009, only nine have been better than expected, while 20 have missed the mark – that’s more than two-thirds of the time! In terms of the equity market’s reaction to Advance GDP reports, there hasn’t been a clear trend. Overall, the S&P 500 has averaged a gain of 0.10% (median: -0.03%) with positive returns a little less than half of the time.
The Closer 7/28/16 – GDP Trading Down, Homeownership Out
Looking for deeper insight on global markets and economics? In tonight’s Closer sent to Bespoke clients, we preview tomorrow’s GDP report with a review of the slide in the Atlanta Fed’s GDPNow forecast. We also discuss fresh data today from the US Census on the American housing market and real yields.

The Closer is one of our most popular reports, and you can sign up for a trial below to see it and everything else Bespoke publishes free for the next two weeks!
Click here to start your no-obligation free Bespoke research trial now!
ETF Trends: International – 7/28/16
Below is our daily list of the twenty best and twenty worst performing ETFs over the last five trading days. Natural gas has lurched higher over the last week while anything tied to industrial metals has performed well. Turkey has gotten a big bounce in the wake of the recent coup attempt, while Homebuilders were also surprisingly strong. Oil continues to get hit as oil-linked ETFs are near the bottom in terms of performance. Oil-linked economies like Norway have also started to slide, as have solar stocks.

Bespoke provides Bespoke Premium and Bespoke Institutional members with a daily ETF Trends report that highlights proprietary trend and timing scores for more than 200 widely followed ETFs across all asset classes. If you’re an ETF investor, this daily report is perfect. Sign up below to access today’s ETF Trends report.
See Bespoke’s full daily ETF Trends report by starting a no-obligation free trial to our premium research. Click here to sign up with just your name and email address.
Bespoke’s Sector Snapshot — 7/28/16
We’ve just released our weekly Sector Snapshot report (see a sample here) for Bespoke Premium and Bespoke Institutional members. Please log-in here to view the report if you’re already a member. If you’re not yet a subscriber and would like to see the report, please start a 14-day trial to Bespoke Premium now.
Below is one of the many charts included in this week’s Sector Snapshot, which shows the percentage of stocks in each sector trading above their 50-day moving averages. Overall, breadth levels are very healthy, with 75% of all S&P 500 stocks above their 50-days. Most cyclical sectors have readings even stronger than 75%, but as you’ll notice in the chart, there’s one standout on the downside — Energy.
To see our full Sector Snapshot with additional commentary plus six pages of charts that include analysis of valuations, breadth, technicals, and relative strength, start a 14-day free trial to our Bespoke Premium package now. Here’s a breakdown of the products you’ll receive.
