Chart of the Day – Sun Starting to Shine on Financials
Dynamic Upgrades/Downgrades: 8/10/16
The Closer 8/9/16 – Consumer Credit Climbs, Productivity Plunge
Looking for deeper insight on global markets and economics? In tonight’s Closer sent to Bespoke clients, we summarize the release of quarterly consumer credit by the New York Fed and the quarterly productivity report from the BLS.

The Closer is one of our most popular reports, and you can sign up for a trial below to see it and everything else Bespoke publishes free for the next two weeks!
Click here to start your no-obligation free Bespoke research trial now!
ETF Trends: Hedge – 8/9/16
Below is our daily list of the twenty best and twenty worst performing ETFs over the last five trading days. Oil prices were essentially unchanged from yesterday, but the oil exposures remained the winners of the past five days. The rest of the top performers were also nearly identical to yesterday in standing and in price. On the bottom performing side, it was a similarly unexciting day, with the gold and silver stocks not moving much from yesterday but maintaining their losing positions on the week.

Bespoke provides Bespoke Premium and Bespoke Institutional members with a daily ETF Trends report that highlights proprietary trend and timing scores for more than 200 widely followed ETFs across all asset classes. If you’re an ETF investor, this daily report is perfect. Sign up below to access today’s ETF Trends report.
See Bespoke’s full daily ETF Trends report by starting a no-obligation free trial to our premium research. Click here to sign up with just your name and email address.
Bespoke Stock Scores: 8/9/16
Chart of the Day: Late-Day Buying
B.I.G. Tips – Checkup on New Highs
Of the many breadth measures we track, one of the most useful for us is the percentage of stocks making new 52-week highs. When the market rallies and breaks out to a new high, you want to see the list of individual stocks making new highs getting larger. If that doesn’t happen, it is a signal that the rally is narrowing, and it can be a warning that the rally is coming to an end. That’s exactly what we saw in early 2015 when the S&P 500 rallied to new highs while the list of new individual stock highs began to contract.
Conversely, when the market is in a downturn, it is also important to watch the list of new lows to see how much participation there is in the downturn. Last August when equities tumbled, the percentage of S&P 500 stocks making new lows surged to 37.7% of the stocks in the index – the most negative reading since October 2011! The market bounced to close out 2015, but then it turned lower again following the hike in rates in December and the subsequent crash in oil prices. In late January of this year, the S&P 500 tested its August 2015 lows and the percentage of stocks making new lows also dropped down to similar levels (-36.9). From there, there was a feeble rally attempt which failed, but importantly when the S&P 500 broke down to new lows in early February, the percentage of stocks making news lows contracted to just 19.4%. This was a bullish divergence.
So how have new highs been trending in the S&P 500’s most recent leg higher? In a B.I.G. Tips report just sent out to Bespoke Premium and Bespoke Institutional clients, we provide an analysis of trends in 52-week highs for the S&P 500 and each of the ten sectors. We have also included a really interesting screen of stocks that are within 5% of a 52-week high but haven’t traded to a 52-week high in at least a year. To see the entire analysis, please sign up for a monthly Bespoke Premium membership below!
See the full B.I.G. Tips report by signing up for a monthly Bespoke Premium membership now. Click this link for a 10% discount ($89/month).
Dynamic Upgrades/Downgrades: 8/9/16
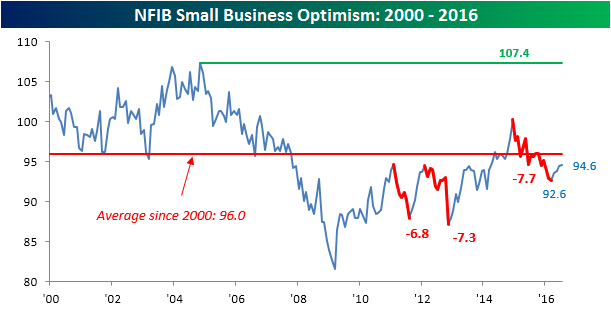
NFIB Rises Again
After a three-month losing streak earlier this year, which was the longest since 2013, the NFIB Index of Small Business Optimism increased for the fourth straight month in July. 2013 was also the last time we saw a four-month winning streak. Despite the four straight monthly gains, though, small business optimism is nowhere near ebullient. This month’s reading came in at a level of 94.6 versus 94.5 last month. As shown in the longer term chart below, the headline index is still more than a point below its average of 96.0 going back to 2000 and hasn’t even made up half of the 7.7 point decline it saw from the end of 2014 through earlier this year. So there’s still a way to go.
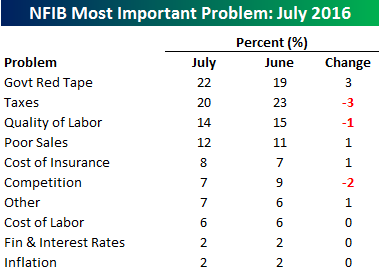 In terms of the biggest problems businesses are facing, in July, more businesses cited Government Red Tape (22%) while fewer cited Taxes (20%). The only other major change in the various categories was Competition which declined from 9% down to 7%. As shown in the chart below, after trending lower for over a year now, the percentage of businesses citing Government Red Tape made a higher high this month and is getting back up near its all-time high (24). One potential explanation for the uptick could be related to the fact that as the political season heats up, we begin to hear more and more about how government regulations are such a large burden on small businesses and that various candidates will alleviate these burdens.

The Closer 8/8/16 – Crude Carry
Looking for deeper insight on global markets and economics? In tonight’s Closer sent to Bespoke clients, we take a look at using oil as a portfolio hedge versus other assets.
The Closer is one of our most popular reports, and you can sign up for a trial below to see it and everything else Bespoke publishes free for the next two weeks!
Click here to start your no-obligation free Bespoke research trial now!