Dynamic Upgrades/Downgrades: 8/12/16
The Closer 8/11/16 – FX & Mortgage Interest
Looking for deeper insight on global markets and economics? In tonight’s Closer sent to Bespoke clients, we take a look at the drivers of returns this year versus the USD in FX markets. We also review quarterly mortgage delinquency and foreclosure data from the Mortgage Bankers’ Association.

The Closer is one of our most popular reports, and you can sign up for a trial below to see it and everything else Bespoke publishes free for the next two weeks!
Click here to start your no-obligation free Bespoke research trial now!
Bespoke’s Sector Snapshot — 8/11/16
We’ve just released our weekly Sector Snapshot report (see a sample here) for Bespoke Premium and Bespoke Institutional members. Please log-in here to view the report if you’re already a member. If you’re not yet a subscriber and would like to see the report, please start a 14-day trial to Bespoke Premium now.
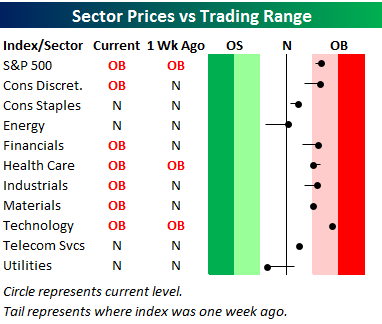
Below is one of the many charts included in this week’s Sector Snapshot, which is our trading range screen for the S&P 500 and its ten sectors. We discuss in more detail how to read the chart in the full version of the report, but basically the dot is where the sector is currently trading, while the tail end is where it was trading one week ago. As shown, the S&P 500 and nine of ten sectors are now back above their 50-day moving averages, while the one sector below its 50-DMA is very defensive in nature — Utilities.
To see our full Sector Snapshot with additional commentary plus six pages of charts that include analysis of valuations, breadth, technicals, and relative strength, start a 14-day free trial to our Bespoke Premium package now. Here’s a breakdown of the products you’ll receive.
S&P 500 Total Return vs. Price
The orange line in the chart below is the standard S&P 500 price chart that everyone uses when tracking the index’s day-to-day, month-to-month and year-to-year performance. You can see the recent break-out above last year’s highs all the way to the right of the chart.
If you want to see how important dividends are to equity market performance, look no further than the S&P 500 total return index, which factors in the index’s dividends and re-invests them. Going back to 1990, the S&P 500 price index is up 517%. The S&P 500 total return index is up just about double that at 989%, and it has exploded higher over the last four years. This should be exhibit A when explaining the importance of dividend yields as well as long-term buy and hold. If you’re going to try and jump in and jump out of the market over a long period of time and you want to beat a typical broad-based buy and hold strategy, you better be darn good!
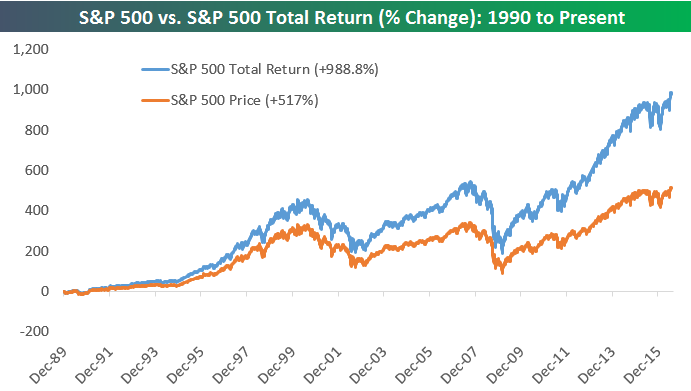
Chart of the Day – Developed Breakout
ETF Trends: International – 8/11/16
Below is our daily list of the twenty best and twenty worst performing ETFs over the last five trading days. Similar to yesterday, 19 of the top 20 stocks were regional and country based exposures, with Mexico, Vietnam and Turkey topping the list. US Oil & Gas Exploration and Production rounded out the top 20. Natural Gas was the biggest loser on the week, followed by Coffee and Biotech. Gold and silver stocks also continued to struggle.

Bespoke provides Bespoke Premium and Bespoke Institutional members with a daily ETF Trends report that highlights proprietary trend and timing scores for more than 200 widely followed ETFs across all asset classes. If you’re an ETF investor, this daily report is perfect. Sign up below to access today’s ETF Trends report.
See Bespoke’s full daily ETF Trends report by starting a no-obligation free trial to our premium research. Click here to sign up with just your name and email address.
the Bespoke 50 — 8/11/16
Sentiment Little Changed
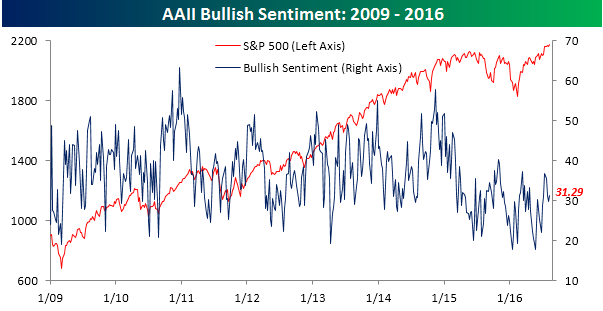
The market and jobless claims have gone sideways, so it only seems fitting that sentiment has started to flat-line as well. In the latest sentiment survey from the American Association of Individual Investors (AAII), bullish sentiment saw a modest increase from 29.79% up to 31.29%, and right back where it was two weeks ago (31.25%). This now makes it 41 straight weeks where bullish sentiment has been below 40%, which is the longest streak on record.
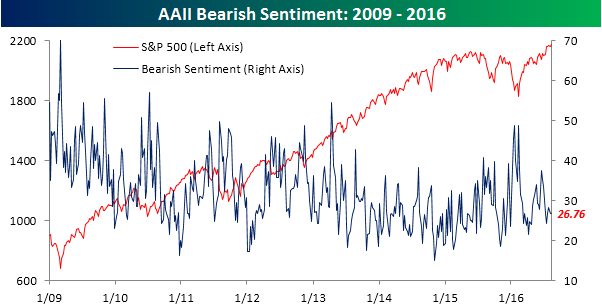
The change in bearish sentiment this week was even smaller than bullish sentiment. After falling to a level of 26.77% last week, bearish sentiment declined this week to a level of…wait for it now, 26.76%, or 0.01%!
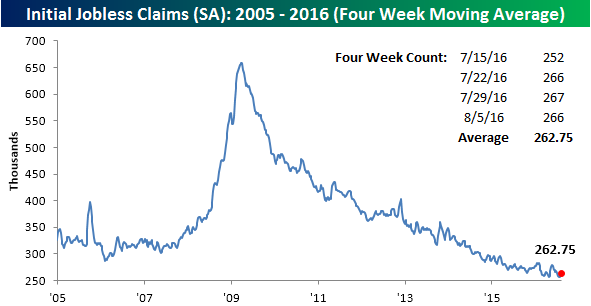
Jobless Claims Go Sideways
Jobless claims fell from 267K down to 266K this week, which was slightly higher than expectations for 265K. While technically higher than expected, when the reported number is within 1K of the estimate, it’s close enough for government work. Over the last three weeks now, the weekly prints for jobless claims have been 266K, 267K, and 266K, so it looks as though jobless claims are following the lead of equities these days and doing nothing. With this week’s reading, jobless claims have now been below 300K for 75 straight weeks, which is the longest streak since 1970. To beat the 1970s streak, however, jobless claims will need to remain below 300K for another 86 weeks, so we hope you have some time!

Even though weekly claims declined slightly, we dropped another lower number from the count this week, so the four-week moving average increased from 259.75K up to 262.75K. It has now been 16 weeks since we last made a cycle low in the four-week moving average. We got close to a new low two weeks ago but came up just short.
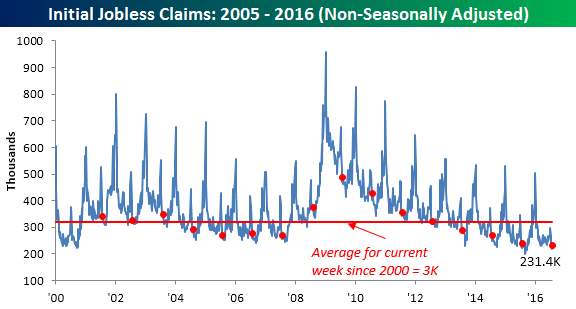
On a non-seasonally adjusted (NSA) basis, claims were 231.4k, which was up from 219.2K last week. This week’s reading is more than 8% below the average for the current week of the year dating back to 2000, and the lowest level for the current week of the year since 1969!
Bespoke’s Paul Hickey Discusses Volume on Bloomberg TV
Bespoke co-founder Paul Hickey appeared on Bloomberg TV this morning to discuss low volume levels and what it means for the market. Paul also discusses the “Smart Money Indicator” and which direction it’s headed right now. View the segment by clicking the thumbnail image below.
