Chart of the Day – Volume, Like Paint, Drying Up
 In many ways, the last few weeks for the market have been like watching paint dry, as volatility has been non-existent. Given it’s August, this is the way it normally is, so we aren’t complaining. Along with the lack of volatility, volume has really dried up as well. In fact, the last time that we had an above average volume day in the S&P 500 tracking ETF (SPY) was on July 15th. That’s 25 straight days of below average volume.
In today’s Chart of the Day, which was sent to paid subscribers, we looked at prior periods where volume in SPY was below average for at least 25 trading days and then provided an analysis of the ETF’s returns going forward. To see the report, please start a 14-day free trial to Bespoke’s paid research below.
Google (Alphabet) IPO: 12 Years Later
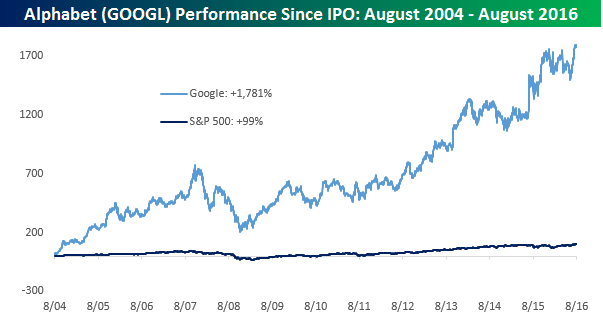
Given it’s one of the largest publicly traded companies in the world, it is hard to imagine that Google’s (now Alphabet) IPO was 12 years ago today. After coming out at a split-adjusted basis of $42 in August 2004, given the unconventional process by which it conducted its IPO, a lot of critics said the company had left some money on the table. Boy did they ever! We say that in a tongue and cheek manner, but since that IPO twelve years ago, Google (GOOGL) has gained 1,781% compared to a gain of 99% for the S&P 500. That’s what you call generating alpha.
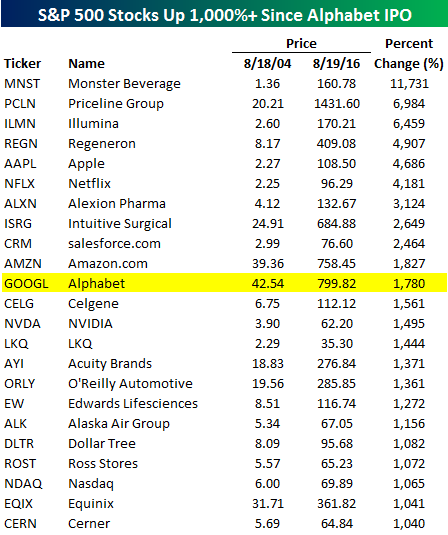
GOOGL’s gain has been impressive, but it actually hasn’t been close to the best performing stock over that time period. In fact, there are ten current members of the S&P 500 that are up more than GOOGL since the date of its IPO. Leading the way higher, shares of Monster Beverage (MNST) are up over 11,000%! Behind MNST, shares of Priceline (PCLN) and Illumina (ILMN) are up triple GOOGL’s gain. Additionally, Regeneron (REGN), Apple (AAPL), and Netflix (NFLX) are all up over 4,000%. Overall, there are 23 current members of the S&P 500 that are up 1,000%+ since the GOOGL IPO 12 years ago. If only a portfolio consisted of just these names.
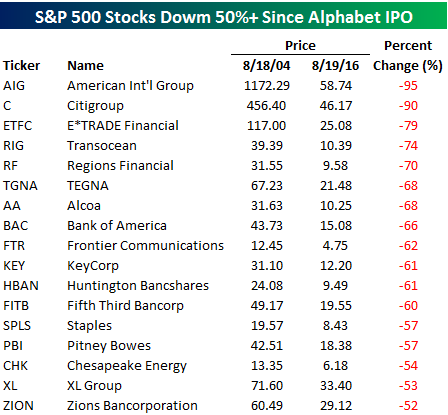
It hasn’t all been roses for stocks in the S&P 500 over the last 12 years, though. Of the 404 components that have been trading for the last 12 years, 43 are down, and that doesn’t even take into account the number of stocks that fell out of the index due to declines, outright bankruptcies, or a corporate action. The table below lists the 17 stocks in the index that have lost more than half of their value in the last twelve years. It may be hard to believe now, but AIG is down 95% in the last 12 years. In order to get back to where it was 12 years ago, AIG would need to see a rally in excess of the rally that GOOGL has seen in the last 12 years. Citigroup (C) has also lost 90% of its value in the last 12 years, so that would need to rally 900% to get back to even. Looking at the names on the list, the majority are from the Financial sector, but there are also a number of stocks from the Energy sector as well given the carnage that sector has seen in the last twelve years.
Heatmapping Sector Rotation
There has been lots of chatter about “sector rotation” in 2016, much more so than we’ve seen in prior years. We wanted to see if we could highlight this sector rotation in chart form, and the best way to do that is using a heatmap. Below, we chart a heatmap of rolling 3-month performance (%) for the ten S&P 500 sectors, with more defensive sectors at the top of the graph and more cyclical sectors at the bottom. Green (from lighter to darker) indicates a period of outperformance over the prior three months, while red (lighter to darker) indicates a period of underperformance. As the chart shows, more defensive sectors have started to stumble recently while the more cyclical Technology sector and to a lesser degree Health Care and Industrials have rallied over the last three months. We note that while the “middle” of the chart — Energy and Materials — were both extremely strong gainers for most of the year following their plunge at the start of 2016, they haven’t been ramping up to the same degree recently. Tech has seen an extremely strong performance over the last few months as the more cyclical stocks in general have benefited from improving economic sentiment.
Overall, we think this heatmap does a good job of showing rotation in and out of various sectors over the last year. There’s only one sector of the ten — Industrials — that hasn’t gone through a period of big outperformance (dark green) or big underperformance (dark red) over the last year.

Bespoke Earnings Estimate Revisions: 8/19/16
Dynamic Upgrades/Downgrades: 8/19/16
The Closer 8/18/16 – Heatmaps Galore, Leading Indices A Snore
Looking for deeper insight on global markets and economics? In tonight’s Closer sent to Bespoke clients, we use heatmaps to detail YTD and rolling 3m performance within the US market’s sectors and the broader global equity market. We also discuss national and state-level leading indices.

The Closer is one of our most popular reports, and you can sign up for a trial below to see it and everything else Bespoke publishes free for the next two weeks!
Click here to start your no-obligation free Bespoke research trial now!
ETF Trends: International – 8/18/16
Below is our daily list of the twenty best and twenty worst performing ETFs over the last five trading days. Oil continues to move up as front-month contracts have now rallied 20% from their recent low. Telecoms have gotten absolutely demolished, as well as the USD, while Emerging Markets have given up some of the shine over the last few days. Joining oil on the best performers list was natural gas, energy-related equities, and other EMs like China. It’s also rare to see currency ETFs among the best performers (they aren’t very volatile) but both EUR and CHF have rallied huge versus the dollar over the past week.

Bespoke provides Bespoke Premium and Bespoke Institutional members with a daily ETF Trends report that highlights proprietary trend and timing scores for more than 200 widely followed ETFs across all asset classes. If you’re an ETF investor, this daily report is perfect. Sign up below to access today’s ETF Trends report.
See Bespoke’s full daily ETF Trends report by starting a no-obligation free trial to our premium research. Click here to sign up with just your name and email address.
S&P 500 Energy Sector Breaks Above Sideways Range
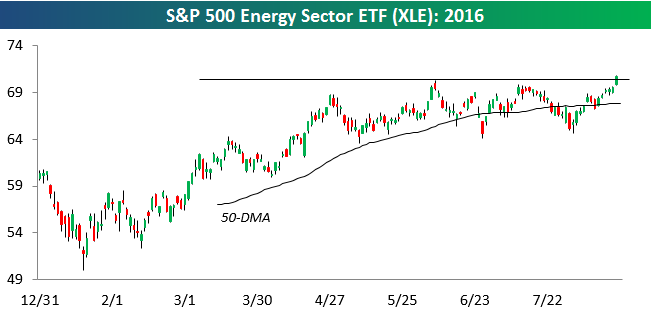
After surging off its February lows through late May, the S&P 500 Energy sector (XLE) went into a sideways trading pattern for much of the summer. The ETF’s sideways range was between $63 on the downside and $70 on the upside. Just over two weeks ago, the ETF tested the bottom of its sideways range, and the support held. Now today, the ETF finally managed to break through resistance at $70 at the top of the range. Energy bulls can rejoice for the time being.
Bespoke’s Sector Snapshot: 8/18/16
We’ve just released our weekly Sector Snapshot report (see a sample here) for Bespoke Premium and Bespoke Institutional members. Please log-in here to view the report if you’re already a member. If you’re not yet a subscriber and would like to see the report, please start a 14-day trial to Bespoke Premium now.
Below is one of the many charts included in this week’s Sector Snapshot, which is our trading range screen for the S&P 500 and its ten sectors. We discuss in more detail how to read the chart in the full version of the report, but basically the dot is where the sector is currently trading, while the tail end is where it was trading one week ago. As shown, the S&P 500 and most sectors haven’t moved at all within their trading ranges over the last week, but Energy is one that moved up sharply, while Utilities and Telecom moved lower.
To see our full Sector Snapshot with additional commentary plus six pages of charts that include analysis of valuations, breadth, technicals, and relative strength, start a 14-day free trial to our Bespoke Premium package now. Here’s a breakdown of the products you’ll receive.
