World Markets Back to Neutral
Ten days ago we published a post titled “World Overbought” that featured our country ETF trading range screen. At the time, 25 of the 30 country ETFs we track in the screen were in “overbought” territory — extended well above their 50-day moving averages. As shown below, that’s no longer the case, as just 3 of 30 countries remain overbought. Over the last week, we’ve seen a pullback for equities pretty much across the world as global investors take a break following big gains in July and early August. The large majority of countries remain above their 50-day moving averages, however, meaning they’re still trading above short-term uptrend support levels.
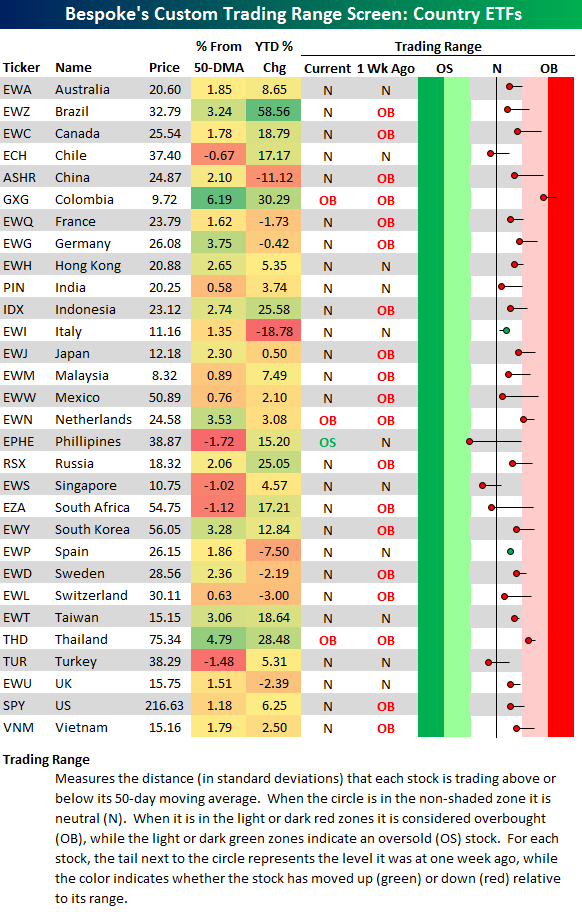
Chart of the Day: Labor Day Market Returns
Sector Breadth Weakens
The S&P 500 is up 6.10% year-to-date, and as shown below, seven of ten S&P 500 sectors are outperforming that mark. Telecom, Utilities and Energy are up the most at 14%+, while Materials is up 11.78%. The three underperforming sectors are Consumer Discretionary, Health Care, and Financials.
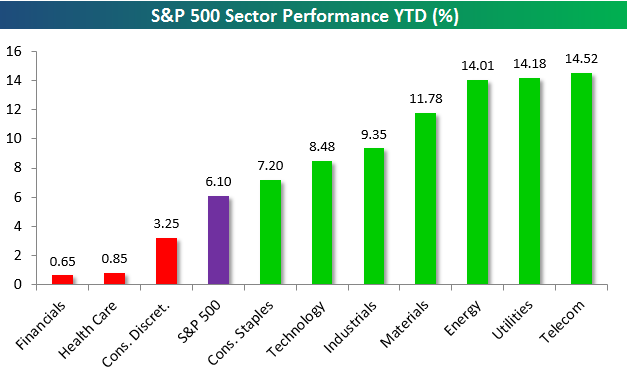
The reason the S&P 500 is up just 6% even though seven sectors are doing better than that is because the top five performing sectors this year are also the smallest five sectors in the index. Financials, Health Care and Consumer Discretionary — the three underperformers — are the 2nd through 4th largest sectors in the index.

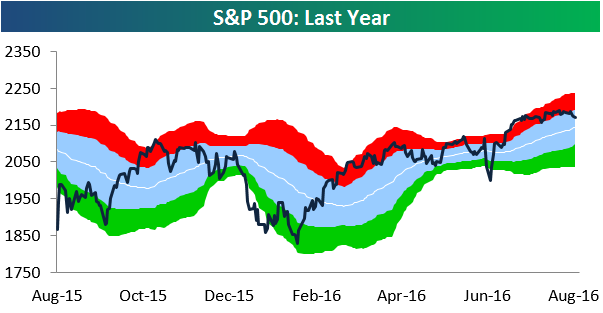
The S&P 500 continues to trend lower within its range as we close out the week. A month and a half ago, the index was at the same level that it’s at now, but it was much more overbought. You can see this in our trading range chart of the S&P below:
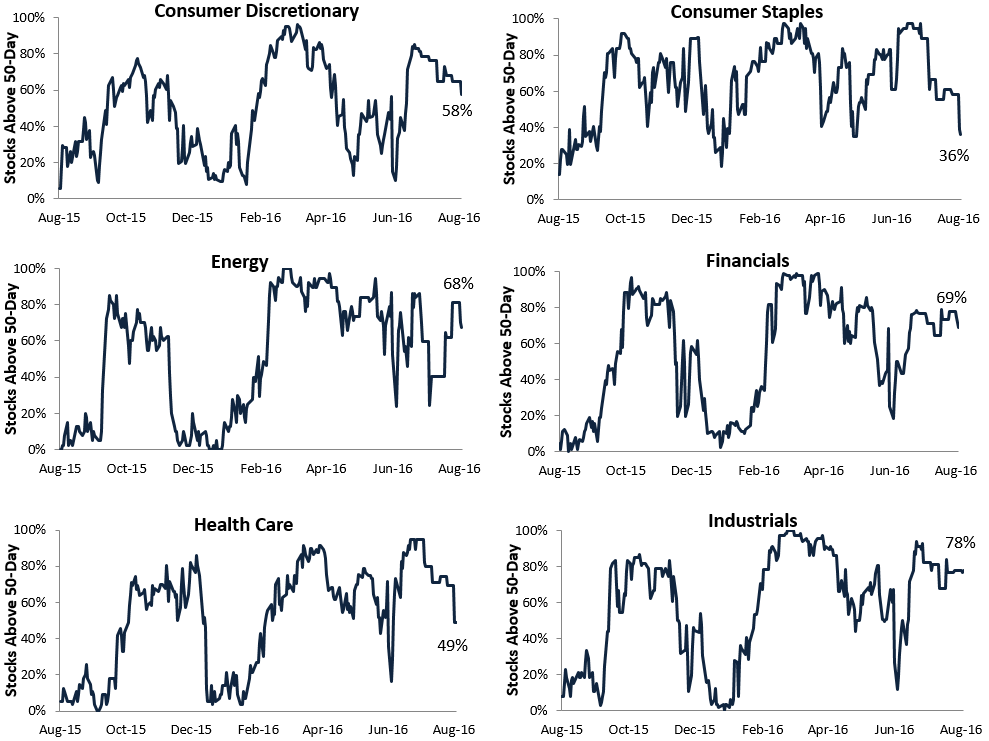
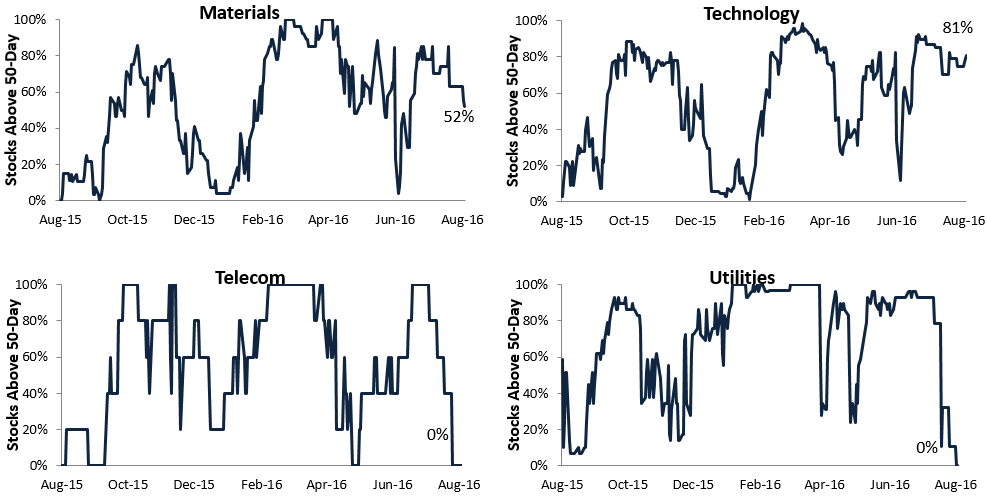
As the market pulls back, breadth is losing a bit of steam. As of early afternoon, just 60% of stocks in the S&P were above their 50-day moving averages:

Below is a look at sector breadth levels. Technology currently has the strongest breadth with 81% of its stocks above their 50-days. Industrials ranks second at 78%, followed by Financials at 69% and Energy at 68%. There are zero stocks above their 50-DMAs in both the Utilities and Telecom sectors.
ETF Trends: Fixed Income, Currencies, and Commodities – 8/26/16
Natural gas continues to trend steadily higher, and we saw something of a bounce over the past week from peripheral countries like Italy and Spain. Bonds got a boost today following Janet Yellen’s 10:00 AM speech in Jackson Hole, Wyoming, while oil-related plays and gold miners have been down the most over the past week.

Bespoke provides Bespoke Premium and Bespoke Institutional members with a daily ETF Trends report that highlights proprietary trend and timing scores for more than 200 widely followed ETFs across all asset classes. If you’re an ETF investor, this daily report is perfect. Sign up below to access today’s ETF Trends report.
See Bespoke’s full daily ETF Trends report by starting a no-obligation free trial to our premium research. Click here to sign up with just your name and email address.
Q2 GDP Revised Down Slightly On 2nd Estimate
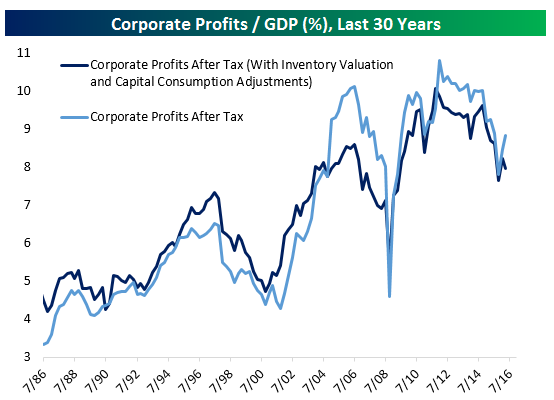
The BEA released its second of three estimates for Q2 2016 GDP today. The release came in at +1.1% QoQ SAAR versus +1.22% SAAR in the first reading; that downward revision was bang-on economists’ estimates. The second release gave us an update on corporate profits. After tax, without adjustments to take into account changes in the value of inventories and the consumption of fixed capital, corporate profits bounced from 8.48% of GDP to 8.82%. Over the last two quarters, the measure is up 1.01%, the biggest jump since the 1.03% leap in the two quarters ending Q1 2012. That suggests that the “profits recession” is winding down on an economy-wide basis. However, the lower profit margins sequentially for the broader, most economically relevant definition of profits indicates that it’s not all good news for the corporate sector.
Looking at the revisions to major categories of GDP, consumption was revised up further. It added 2.94% QoQ SAAR to GDP; real consumption grew sequentially at a 4.37% annualized rate in Q2, the second-fastest of the expansion. Upward revision was driven by faster consumption of autos and utilities. There were lots of disappointing revisions as well. Residential fixed investment was revised down 6 bps to -0.30% contribution; the sequential growth rate (-7.7% at an annual rate) was the lowest since 2010. Business fixed investment’s contribution was revised up by 17 bps, with 20 bps of that coming from higher fixed investment in intellectual property products. Trade’s impact on output was revised down, as lower goods exports and higher goods imports reduced the positive impact initially reported in the first estimate of GDP a month ago. Finally, we note that State and Local Government fixed investment contribution was revised down 10 bps, leading to a total contribution downward revision of -11 bps. State and local governments continue to spend less, and that cost a quarter of a point on GDP in total for Q2 per this estimate from the BEA. Below we present a table summarizing this release’s revisions.

The Closer 8/25/16 – Return On Capital, Capital Investment
Looking for deeper insight on global markets and economics? In tonight’s Closer sent to Bespoke clients, we take a look at the return on total capital earned by major US indices. We also recap today’s Durable Goods report.

The Closer is one of our most popular reports, and you can sign up for a trial below to see it and everything else Bespoke publishes free for the next two weeks!
Click here to start your no-obligation free Bespoke research trial now!
Bespoke’s Sector Snapshot — 8/25/16
We’ve just released our weekly Sector Snapshot report (see a sample here) for Bespoke Premium and Bespoke Institutional members. Please log-in here to view the report if you’re already a member. If you’re not yet a subscriber and would like to see the report, please start a 14-day trial to Bespoke Premium now.
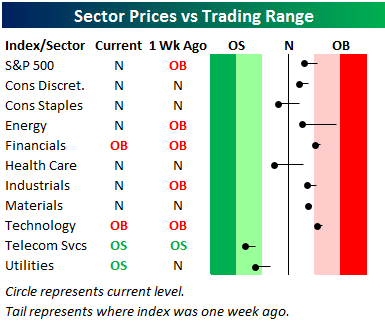
Below is one of the many charts included in this week’s Sector Snapshot, which is our trading range screen for the S&P 500 and its ten sectors. We discuss in more detail how to read the chart in the full version of the report, but basically the dot is where the sector is currently trading, while the tail end is where it was trading one week ago. As shown, the S&P 500 and six of ten sectors are now back into “neutral” territory after trading “overbought” for much of the last two months. Telecom and Utilities — two defensive sectors — are in “oversold” territory, while Technology is the one sector that remains “overbought.”
To see our full Sector Snapshot with additional commentary plus six pages of charts that include analysis of valuations, breadth, technicals, and relative strength, start a 14-day free trial to our Bespoke Premium package now. Here’s a breakdown of the products you’ll receive.