The Closer 8/30/16 – American Home Prices Up, European Confidence Down
Looking for deeper insight on global markets and economics? In tonight’s Closer sent to Bespoke clients, we discuss Case-Shiller home price data for the month of June released today. We also discuss some painful readings this morning on Eurozone confidence indices.

The Closer is one of our most popular reports, and you can sign up for a trial below to see it and everything else Bespoke publishes free for the next two weeks!
Click here to start your no-obligation free Bespoke research trial now!
Seven of Twenty Cities Now Above Housing Bubble Highs
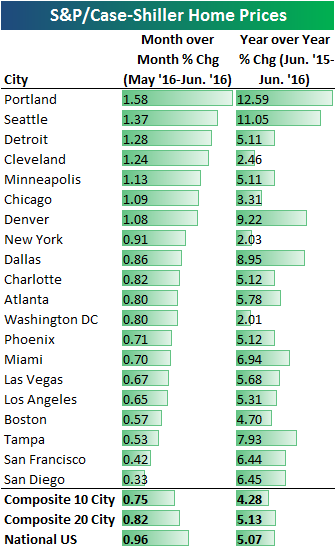
The June readings for S&P/Case Shiller home price indices were published this morning, and below is a table highlighting the month-over-month and year-over-year changes for each of the twenty cities tracked. As shown, home prices increased the most month-over-month and year-over-year in Portland and Seattle. The upper mid-west also saw nice gains in June, with Detroit, Cleveland, Chicago and Minneapolis all gaining more than 1%. New York was in the upper half of the list for month-over-month, but it continues to be one of the weakest cities when looking at year-over-year gains. Interestingly, San Francisco and San Diego saw the smallest month-over-month gains, and San Francisco is no longer at the top of the list in terms of year-over-year gains.
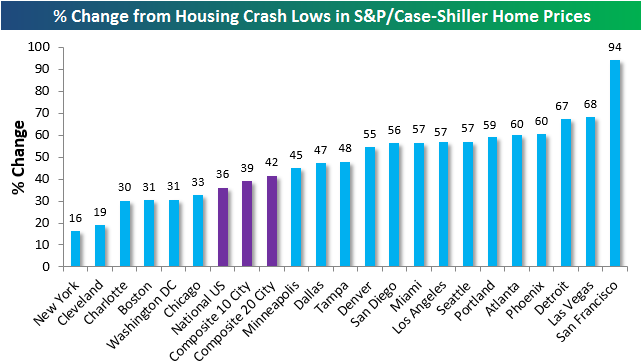
Below is a chart showing how much each city is up off of its low point during the housing crash. San Francisco has nearly doubled at this point with a gain of 94%, while the next biggest jumps are 68% for Las Vegas and 67% for Detroit. New York and Cleveland have seen the smallest bounces at just 16% and 19%, respectively. For the country as a whole, home prices are up roughly 40% off their lows.
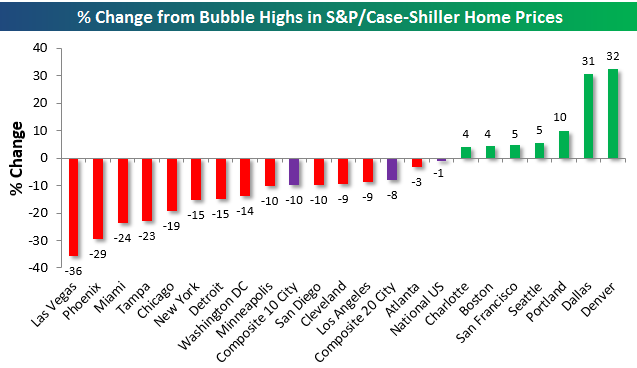
Below we show how far home prices are from their mid-2000s bubble highs (mid-2005 for most cities). We’re now more than 10 years removed from the peak of the housing bubble, and as shown below, seven of twenty cities tracked have now made new all-time highs. Denver and Dallas are by far the farthest above their prior highs at more than 30%. Portland is 10% above its prior bubble highs, while Charlotte, Boston, San Francisco and Seattle are all 4-5% above their prior highs.
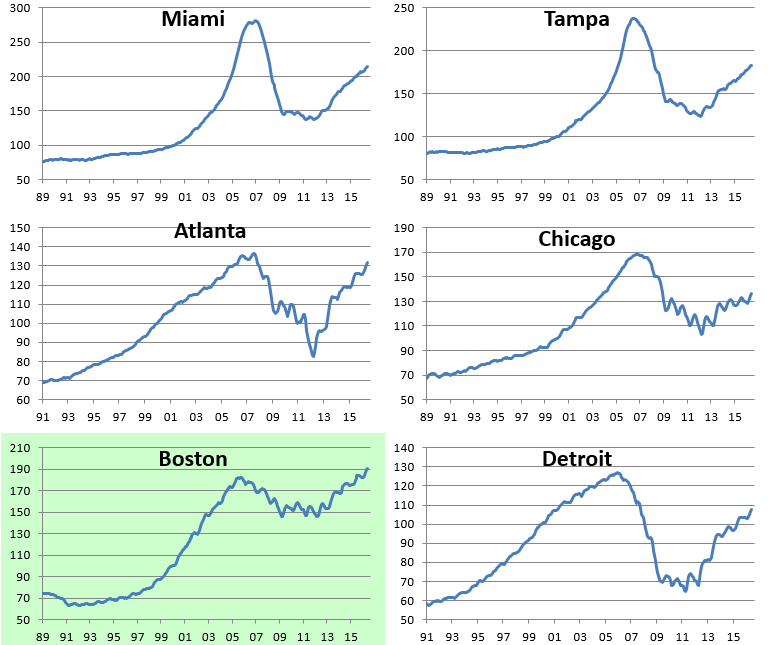
While seven of twenty cities have recovered all of their post-bubble losses and then some, thirteen cities still have a ways to go to get back to their prior highs. Las Vegas is down the most from its highs at -36%, followed by Phoenix (-29%), Miami (-24%), Tampa (-23%), and Chicago (-19%). New York and Detroit are still 15% below their mid-2000s highs.
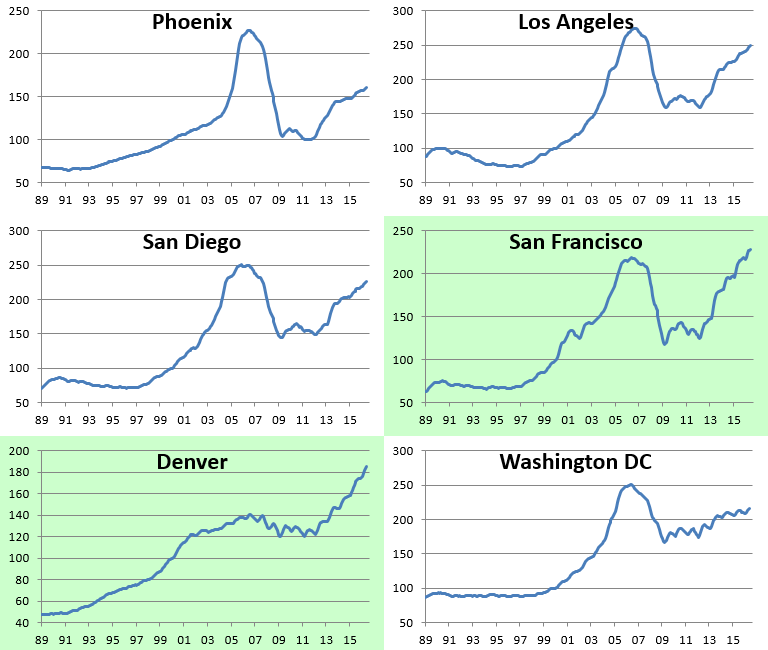
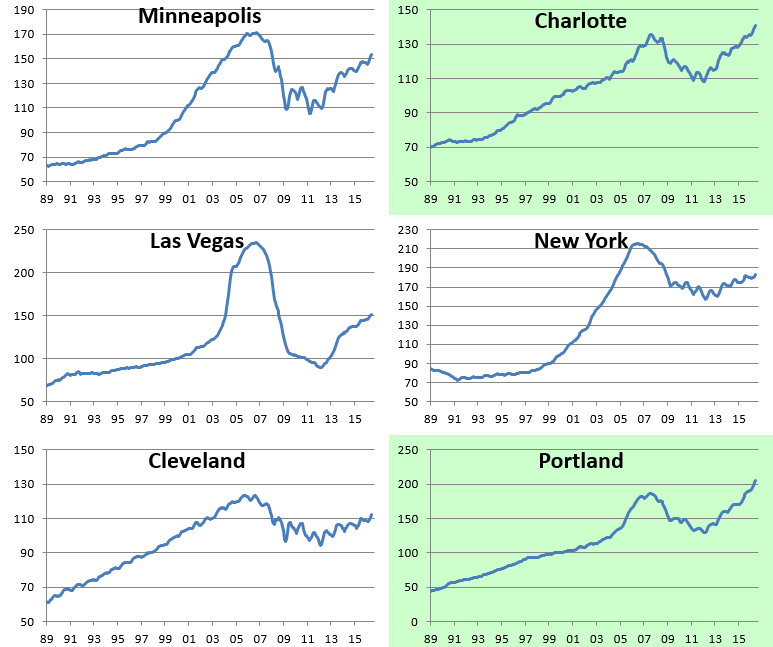
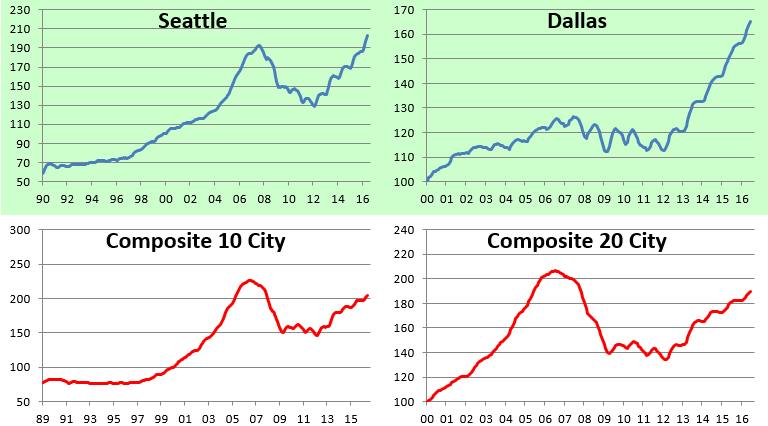
Below are price charts going as far back as 1989 for the twenty S&P/Case-Shiller home price indices. Cities that have eclipsed their prior bubble highs are shaded in light green.
Consumers Expect Labor Market to Deteriorate, Sentiment Says Otherwise
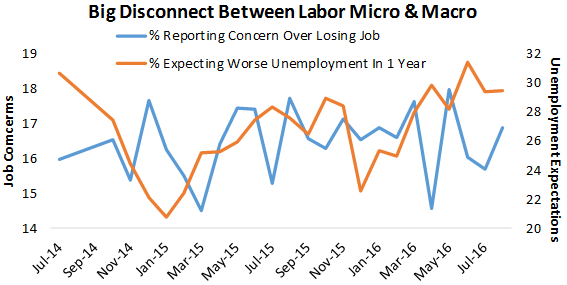
Since January 2015, our monthly Bespoke Consumer Pulse Report has shown that the share of consumers that expect a deteriorating labor market in the US is trending higher. Interestingly, at the same time we haven’t seen an increase in the percentage of consumers concerned about losing their own job. This divergence is fascinating and an excellent indicator that the economy and labor market are much stronger than popular perceptions.
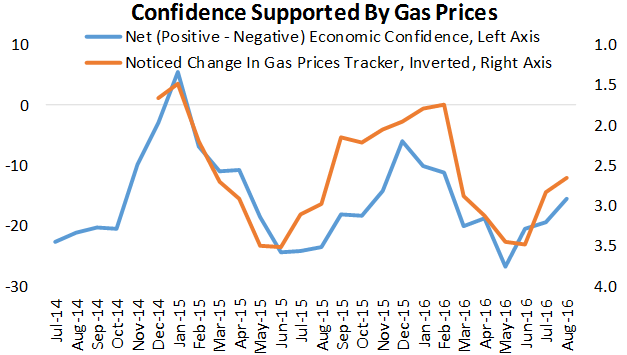
Not only that, but consumers should be feeling good for a number of other reasons. First, gas prices tend to be a great predictor of overall sentiment and with cheaper gas, consumer sentiment has recently picked up with regards to the economy.
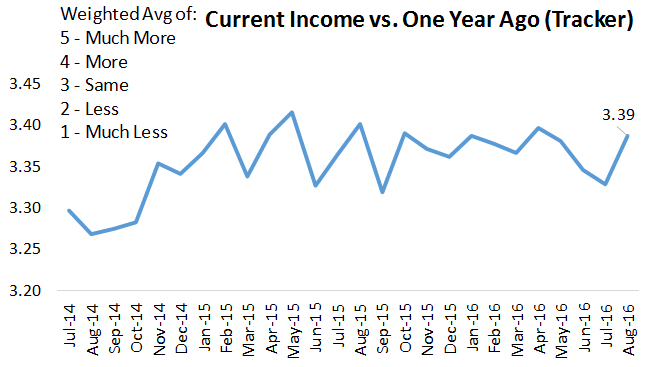
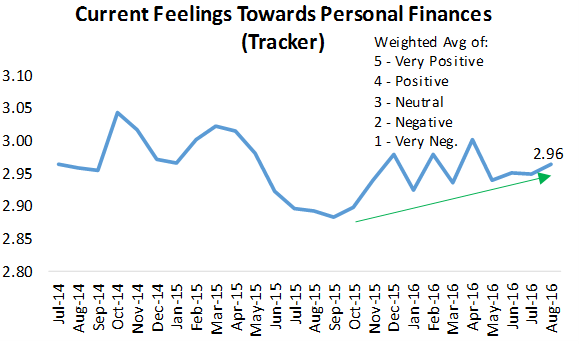
In addition, current income growth has improved after seeing a negative streak for three straight months. Although nominal income growth slowing isn’t necessarily a bad thing for GDP, the psychology of nominal incomes are important. We analyze that psychology by looking at our tracker for current feelings towards personal finances, which has been trending upwards steadily. While consumers clearly are not ecstatic about the outlook for their finances, they’re still seeing improving conditions. So while consumers expect a slowing labor market, their sentiment around job security, gas prices, and income growth/personal finances should ease some of their concerns.
You can see our entire data-set of proprietary survey analysis with a 30-day free trial to our Consumer Pulse offering. We have said it before, but we’ll say it again: The value in the Bespoke Consumer Pulse offering is tremendous. We strongly encourage you to give our Consumer Pulse subscription a try!
Click here to learn more about the Consumer Pulse offering, or go ahead and start a 30-day free trial using one of the checkout links below.
Annual — Bespoke Consumer Pulse — $365/Year w/ 1-Month Free Trial
Monthly — Bespoke Consumer Pulse — $39.99/Month w/ 1-Month Free Trial
B.I.G. Tips – Financial Sector Continues to Rally
Bespoke’s Consumer Pulse Report: August 2016
Bespoke’s Consumer Pulse Report is an analysis of a huge consumer survey that we run each month. Our goal with this survey is to track trends across the economic and financial landscape in the US. Using the results from our proprietary monthly survey, we dissect and analyze all of the data and publish the Consumer Pulse Report, which we sell access to on a subscription basis. Sign up for a 30-day free trial to our Bespoke Consumer Pulse subscription service here.

Chart of the Day: Consumers Confident On The Labor Market
Bespoke Stock Scores: 8/30/16
ETF Trends: Hedge – 8/30/16
It was a similar story again today in terms of recent ETF performance. Natural gas has outperformed, while financial companies (Banks and Insurance) have led the way within the US equity market. After brutal runs of underperformance, DXJ and HEDJ gained this week as local stock markets in Japan and Europe rallied while EUR and JPY declined versus USD. In terms of underperformance, Biotech and Gold Miners stand out, with a smattering of commodity indices and Energy also prominent.

Bespoke provides Bespoke Premium and Bespoke Institutional members with a daily ETF Trends report that highlights proprietary trend and timing scores for more than 200 widely followed ETFs across all asset classes. If you’re an ETF investor, this daily report is perfect. Sign up below to access today’s ETF Trends report.
See Bespoke’s full daily ETF Trends report by starting a no-obligation free trial to our premium research. Click here to sign up with just your name and email address.
Long-Term BRIC Charts
The market action for BRIC (Brazil, Russia, India, China) countries has been pretty good lately. Below we take a look at long-term trading range charts for each of them going back to the start of 2013.
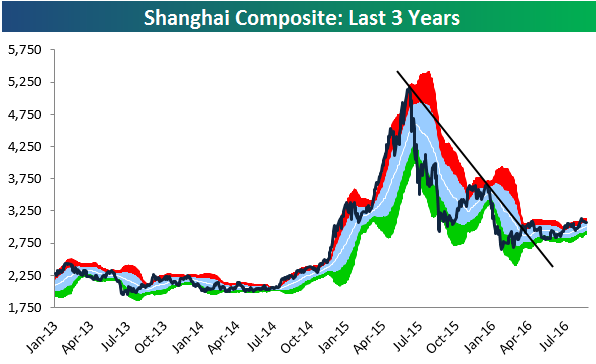
China’s Shanghai Composite experienced a legit crash in the second half of 2015 after an epic run higher from mid-2014 through mid-2015. Since markets bottomed globally back in February, the Shanghai Composite has formed a new short-term uptrend channel, but volatility has declined dramatically, giving investors plenty of time to catch their breaths after an epic boom and bust market cycle. Generally speaking, the action for Chinese stocks has been positive over the last six months.
lndia’s Sensex traded in a downtrend for pretty much all of 2015, but since bottoming earlier this year, the action has been very bullish. In the chart below, you can see a defined uptrend off the lows with a series of higher highs and higher lows. The 50-day moving average (white line) has acted as support multiple times during this run-up. Bulls are still looking for a re-test of prior highs, though.

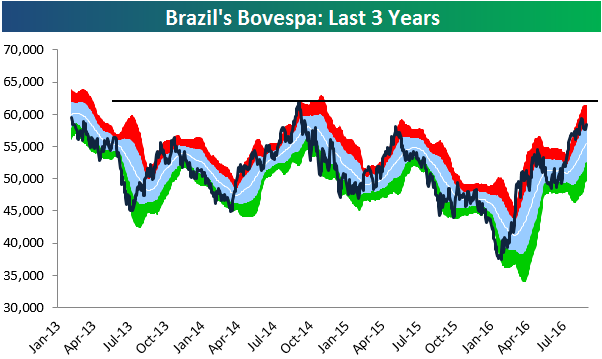
Brazil’s Bovespa has been one of the top performing stock markets in the world this year, but you wouldn’t think it based on the chart below. Even after an epic rally this year, the index has yet to take out its 2014 highs, leaving it in a long-term sideways range. Will we see a breakout before the end of the year? We would expect at least a test of prior highs.
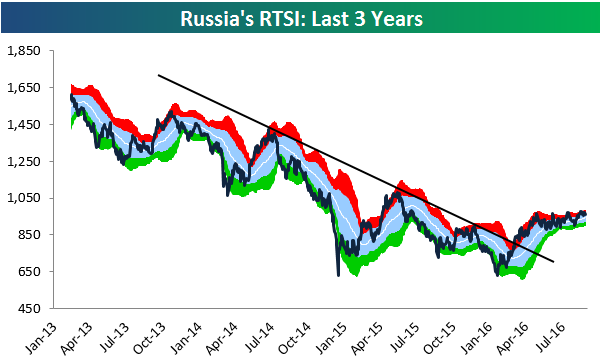
Russia’s stock market hasn’t exactly knocked it out of the park this year, but as shown below, the index has managed to break above the top of the long-term downtrend channel that it had been in for the past three years. Since that trend break, we’ve seen the market go completely sideways. When this sideways trend breaks — either to the upside or the downside — look for a violent move.
The Closer 8/29/16 – Status Of The States
Looking for deeper insight on global markets and economics? In tonight’s Closer sent to Bespoke clients, we tabulate and summarize state level indicators from across the spectrum of economic data. We also present heatmaps of each. Finally, we take a look at what labor market data appears to be having the most impact on the Presidential election.
The Closer is one of our most popular reports, and you can sign up for a trial below to see it and everything else Bespoke publishes free for the next two weeks!
Click here to start your no-obligation free Bespoke research trial now!