Chart of the Day: IBM
Bespoke’s Dow 30 Trading Range Screen
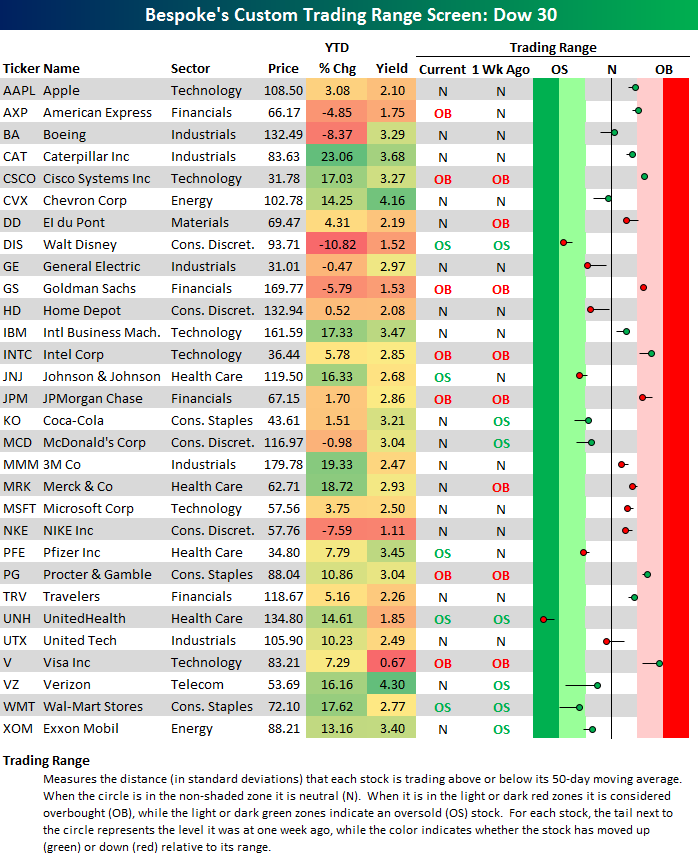
Below is an updated look at our Dow 30 trading range screen. For each stock, the dot represents where it’s currently trading within its range, while the tail end represents where it was trading one week ago. The green and red shaded areas represent oversold and overbought territory.
While the major indices are currently trading slightly into overbought territory, most Dow stocks are neutral. Seven of thirty stocks in the index are overbought, five are oversold, and the remaining eighteen are neutral. Overbought names include American Express (AXP), Cisco (CSCO), Goldman (GS), Intel (INTC), JP Morgan (JPM), Procter & Gamble (PG), and Visa (V), while the five oversold names are Disney (DIS), Johnson & Johnson (JNJ), Pfizer (PFE), UnitedHealth (UNH), and Wal-Mart (WMT).
In this screen, you want to look for stocks with upside momentum picking up. Some standouts at the moment include Boeing (BA), Chevron (CVX), Coca-Cola (KO), McDonald’s (MCD), Verizon (VZ), and Wal-Mart (WMT). All of these names have moved higher within their range over the last week, but they aren’t trading at extreme overbought levels.
Updating year-to-date performance numbers, Caterpillar (CAT) remains the best performing Dow stock in 2016 with a gain of 23%. 3M (MMM), Merck (MRK), Wal-Mart (WMT), and IBM round out the top five. Prior market darling Disney (DIS) has been the worst performing Dow stock this year with a decline of 10%, while Boeing (BA), Nike (NKE), Goldman Sachs (GS), and American Express (AXP) are also solidly in the red.
The Closer 9/7/16 – High Yield And High Unemployment
Looking for deeper insight on global markets and economics? In tonight’s Closer sent to Bespoke clients, we update a few charts on the high yield market as well as our analysis of the relationship between unemployment and other labor market statistics from the JOLTS report.

The Closer is one of our most popular reports, and you can sign up for a trial below to see it and everything else Bespoke publishes free for the next two weeks!
Click here to start your no-obligation free Bespoke research trial now!
Bespoke’s Country Trading Range Screen
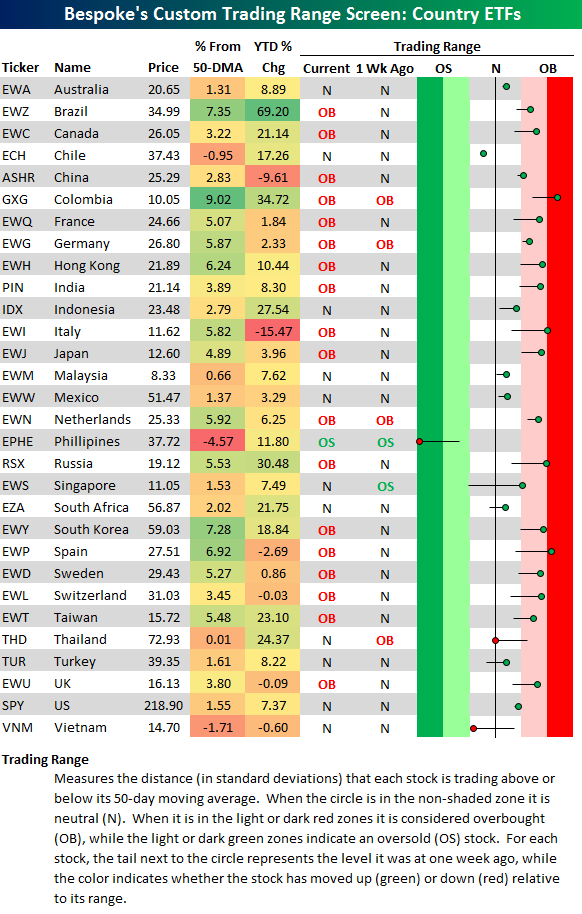
Below is an updated look at our country trading range screen using the 30 largest country stock market ETFs traded on US exchanges. For each ETF, the dot represents where it’s currently trading within its range, while the tail end represents where it was trading one week ago. The green and red shaded areas represent oversold and overbought territory.
As you can see, most country ETFs are now trading back into overbought territory after a week of solid gains. The US (SPY) is one of the few countries that hasn’t moved up within its range over the last week (or much at all in the last few weeks). European markets have really made a nice move higher, and most are now in positive territory for the year. Plenty of countries are now up 20%+ year-to-date as well. As 2016 enters its final stretch, global equities appear to finally be hitting their stride. Let’s see if they’ll end the year on a high note or fade at the finish line.
ETF Trends: Hedge – 9/7/16
Gold miners continued their furious comeback, rising double-digits over the past week. Silver also got in on the action, while New Zealand was the best-performing country ETF we track over the last five days. Emerging markets also performed well, while natural gas, oil, the USD, and banks got hit hard. High yield also underperformed over the past few weeks, though we note that only 8 of the ETFs we tracked dropped by more than 1% over the past week, a remarkable statistic.

Bespoke provides Bespoke Premium and Bespoke Institutional members with a daily ETF Trends report that highlights proprietary trend and timing scores for more than 200 widely followed ETFs across all asset classes. If you’re an ETF investor, this daily report is perfect. Sign up below to access today’s ETF Trends report.
See Bespoke’s full daily ETF Trends report by starting a no-obligation free trial to our premium research. Click here to sign up with just your name and email address.
S&P 500: 40-Day Record Low Hi/Lo Spread
Over the last 40 trading days spanning back to mid-July, the difference between the S&P 500’s highest and lowest daily closing price has been just 1.75%. That’s pretty amazing. And it’s a level of sideways that the US stock market has never experienced before.
Below is a chart showing the 40-trading day high/low closing price spread for the S&P 500 since the index began in 1928. Not one time has a 40-trading day period seen a lower spread. The only period that comes close occurred in the mid-1960s. Who would have thought back in early July just after the Brexit vote and ahead of the 2016 Presidential conventions that the stock market was about to embark on its flattest trek ever.
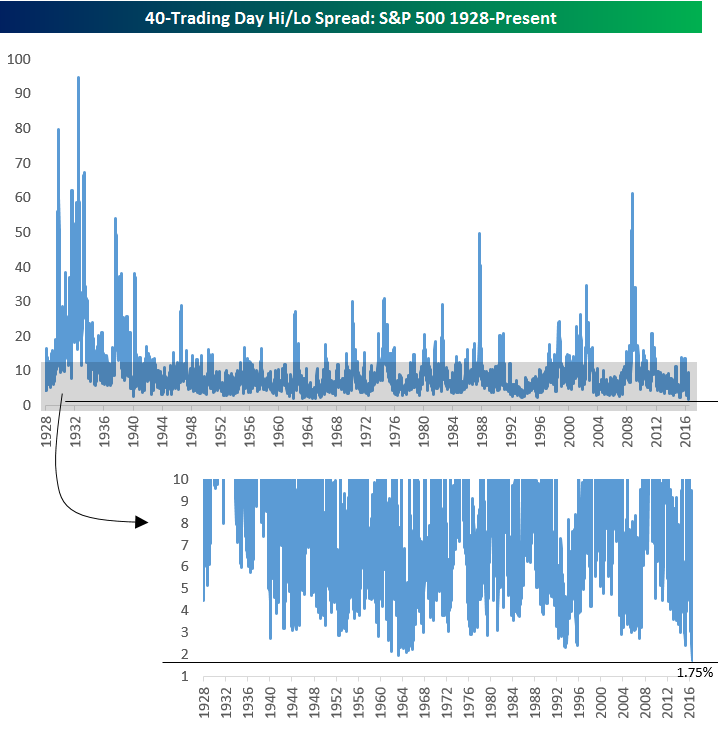
Chart of the Day: FOMC Rate Hikes and Weaker Than Expected Data
Fixed Income Weekly – 9/7/16
Searching for ways to better understand the fixed income space or looking for actionable ideals in this asset class? Bespoke’s Fixed Income Weekly provides an update on rates and credit every Wednesday. We start off with a fresh piece of analysis driven by what’s in the headlines or driving the market in a given week. We then provide charts of how US Treasury futures and rates are trading, before moving on to a summary of recent fixed income ETF performance, short-term interest rates including money market funds, and a trade idea. We summarize changes and recent developments for a variety of yield curves (UST, bund, Eurodollar, US breakeven inflation and Bespoke’s Global Yield Curve) before finishing with a review of recent UST yield curve changes, spread changes for major credit products and international bonds, and 1 year return profiles for a cross section of the fixed income world.
This week, we discuss the enormous flows that investors have poured into fixed income products via mutual funds and ETFs. The flows have implications for yields, market behavior, and returns available to fixed income investors going forward.
Our Fixed Income Weekly helps investors stay on top of fixed income markets and gain new perspective on the developments in interest rates. You can sign up for a Bespoke research trial below to see this week’s report and everything else Bespoke publishes free for the next two weeks!
Click here to start your no-obligation free Bespoke research trial now!
All-Time High For Openings, All-Time Low For Layoffs
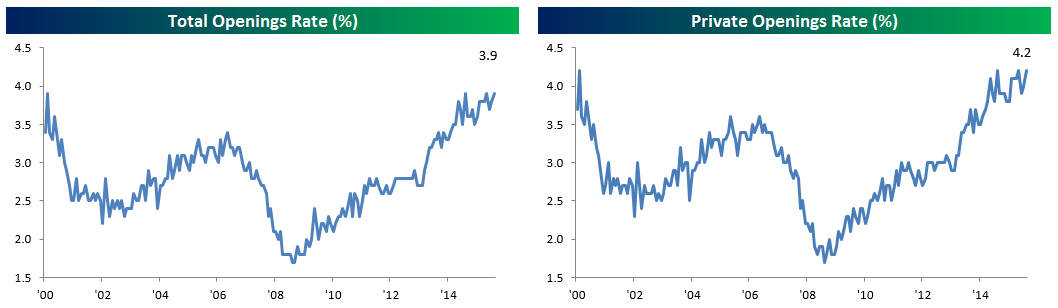
Job openings listed by US private sector firms and government employers (JOLTs) hit a new all-time high in the month of July, painting an extremely rosy picture of the July labor market despite the relatively weak August payrolls report last week. As shown in the left-hand chart below, total separations have cooled off. Therefore while labor demand appears by any measure to be quite high, businesses aren’t having a very hard time holding on to their existing work force.
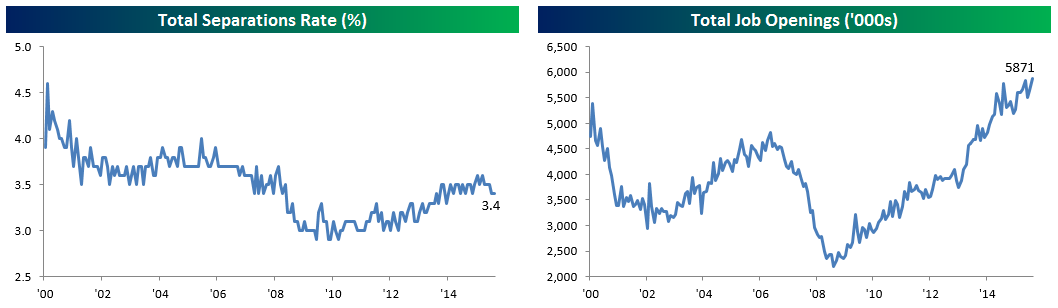
The openings rate and private openings rate are both at all-time highs, tied with two prior periods in the current expansion when they reached their current levels. These both signal strong labor demand from employers.
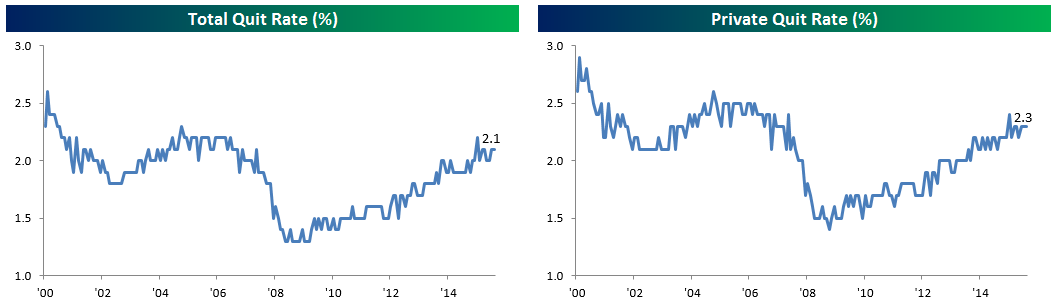
While still trending slowly higher, the quits rate remains quite low relative to the number of job openings reported in the JOLTS survey. The labor market is still not raising pay enough to incentivize employees to either jump ship or stay at their current firm; we think a persistent pessimism and lack of recognition by employees at how tight labor markets are is another factor keeping these rates low.
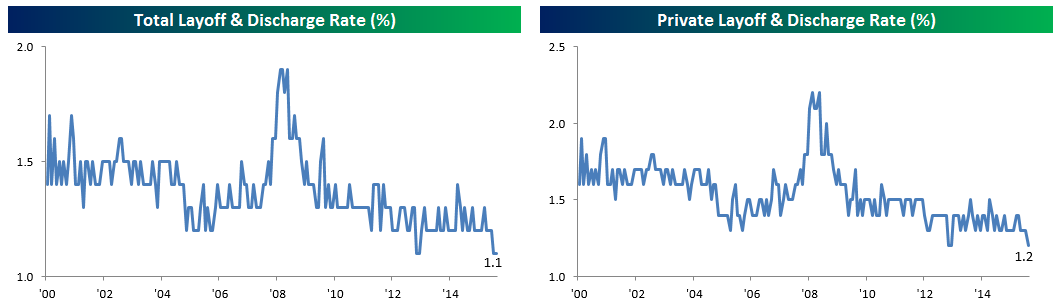
Another strong indication of a healthy labor demand was the second straight month of layoffs sitting at 1.1% of the labor force, the smallest level ever. Private layoffs are down to 1.2% this month, another tied low on an all-time basis.
Finally, looking at industry and geographic trends, it was a bit of a mixed month. Quit rates for most “low pre-requisite” industries are still trending up but not showing any acceleration. On a geographic basis, firings were the lowest on record for the West Census Region.

The Closer 9/6/16 – Cheap Growers
Looking for deeper insight on global markets and economics? In tonight’s Closer sent to Bespoke clients, we take a look at stocks that have both accelerating revenue growth and low forward EV/EBITDA multiples.
The Closer is one of our most popular reports, and you can sign up for a trial below to see it and everything else Bespoke publishes free for the next two weeks!
Click here to start your no-obligation free Bespoke research trial now!