ETF Trends: International – 9/9/16
Oil’s huge inventory draw this week helped it to perform the best among all ETFs we track. Energy equities and gold miners were also strong while Hong Kong, China, and Biotech also put in good showings over the last week. The Philippines faltered, along with semiconductors, homebuilders, and long-term Treasuries. Yield curves around the world steepened sharply with long-term bonds getting hit hard, much harder than short-term yields.

Bespoke provides Bespoke Premium and Bespoke Institutional members with a daily ETF Trends report that highlights proprietary trend and timing scores for more than 200 widely followed ETFs across all asset classes. If you’re an ETF investor, this daily report is perfect. Sign up below to access today’s ETF Trends report.
See Bespoke’s full daily ETF Trends report by starting a no-obligation free trial to our premium research. Click here to sign up with just your name and email address.
Low Volatility? Don’t Judge a Book By Its Cover
As noted in a previous post earlier this week, for the S&P 500 as a whole, there has been a historic lack of volatility over the last several weeks. While it may seem like stocks have done absolutely nothing during this period, there has actually been a good deal of rotation underneath the surface. We touched on this in a previous post, but another way to illustrate it is by looking at how sectors have traded during the period of extreme calm for the S&P 500.
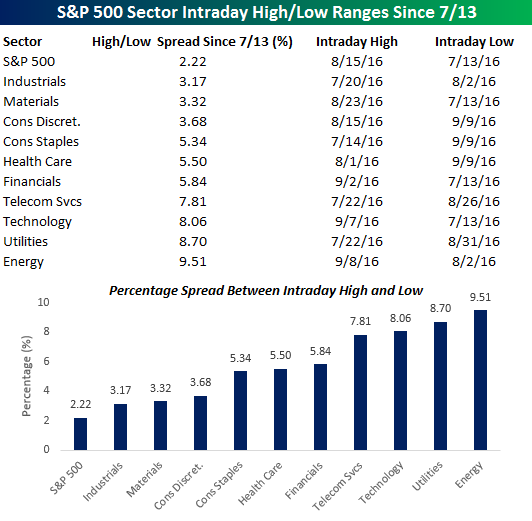
Since the 13th of July, the S&P 500 has traded within a range of 2.22% from its intraday high of 2,193.81 on 8/15/16 and its intraday low of 2,146.21 on 7/13/16. While that range has been narrow, many sectors have seen moves in a magnitude of multiples of the S&P 500. The table and chart below shows the intraday high/low percentage spread of the S&P 500 and all ten sectors since 7/13. As shown, all ten sectors have seen wider ranges than the index as a whole. For seven of those sectors, the high/low range has been more than 5%, and three sectors have traded in ranges in excess of 8%. So if you have been sitting in Spyders (SPY) or an index fund since the middle of July, it was a quiet second half of the summer. However, if you were in a portfolio focused in sectors like Energy, Technology, or even Utilities, it has been anything but a ho-hum two months.
The Closer 9/8/16 – All About Imports
Looking for deeper insight on global markets and economics? In tonight’s Closer sent to Bespoke clients, we dive into the cause of the massive dive crude oil inventories took this week, looking at drove the change, how price action tends to follow historically, and other aspects of the EIA’s petroleum market status report today.

The Closer is one of our most popular reports, and you can sign up for a trial below to see it and everything else Bespoke publishes free for the next two weeks!
Click here to start your no-obligation free Bespoke research trial now!
Bespoke’s Sector Snapshot — 9/8/16
We’ve just released our weekly Sector Snapshot report (see a sample here) for Bespoke Premium and Bespoke Institutional members. Please log-in here to view the report if you’re already a member. If you’re not yet a subscriber and would like to see the report, please start a 14-day trial to Bespoke Premium now.
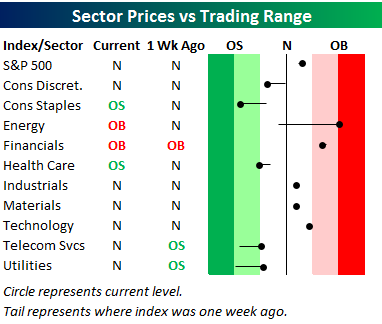
Below is one of the many charts included in this week’s Sector Snapshot, which is our trading range screen for the S&P 500 and its ten sectors. We discuss in more detail how to read the chart in the full version of the report, but basically the dot is where the sector is currently trading, while the tail end is where it was trading one week ago. As shown, the S&P 500 and six of ten sectors are in neutral territory, while Energy has moved into extreme overbought territory. Only one other sector — Financials — is currently overbought. On the other end of the spectrum, Consumer Staples and Health Care are oversold.
To see our full Sector Snapshot with additional commentary plus six pages of charts that include analysis of valuations, breadth, technicals, and relative strength, start a 14-day free trial to our Bespoke Premium package now. Here’s a breakdown of the products you’ll receive.
August 2016 Headlines
Energy Inventories Plunge
Following up on the heels of Wednesday night’s announcement from API that crude oil inventories had plunged in the latest week, Thursday’s update from the DoE confirmed that decline. While traders were expecting crude oil inventories to increase by 905K barrels, stockpiles actually declined by 14.5 million barrels. Yes, you read that correctly. To put that decline in perspective, since 1983 there has only been one other week where weekly inventories declined by a larger amount (1/1/99). As you can imagine, crude oil prices spiked on the news and were up by nearly 4% on the day.
Looking at the chart below, crude oil inventories are still considerably above average after rising throughout much of July and August even as that is usually a period of the year where stockpiles decline. That being said, this week’s drop reversed all of the summer’s build up. What remains to be seen is how much of this week’s decline was related to Hermine travels through the Gulf of Mexico and the east coast this week. In the short term, if you are long crude oil, this week’s drawdown is certainly welcome.

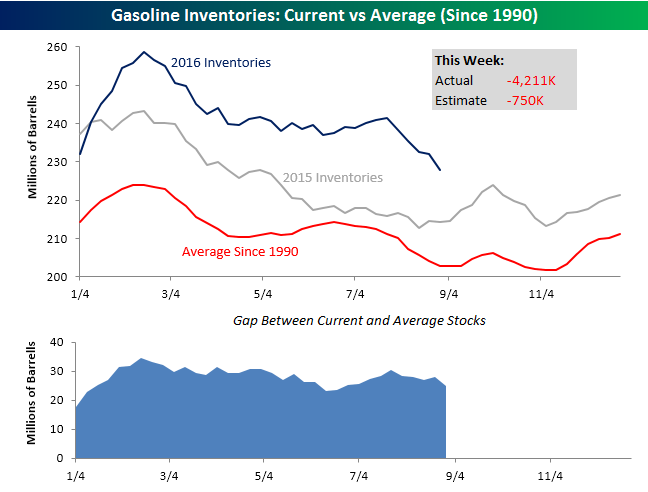
While not quite as dramatic as the drawdown in crude oil, gasoline inventories also saw a large decline. Here, traders were expecting stockpiles to fall by 750K barrels, but the actual decline was more than five times that at 4.211 million barrels. As shown in the chart below, gasoline stockpiles have generally been tracking the seasonal pattern, albeit from a higher starting point. Over the last five weeks, though, the rapid decline in inventories is starting to chip away at the gap between current and average levels.
the Bespoke 50 — 9/8/16
ETF Trends: US Sectors & Groups – 9/8/16
Gold, silver, and emerging markets continue to rally steadily over the past week, with South Africa the best among country ETFs. A strong EIA data release on natural gas inventories today should help push up sagging prices for that commodity, which was down the most among ETFs we track. The USD-tracking UUP has tumbled 1% over the last week as US short-term yields have fallen, also hurting banks. Long-term Treasuries have also underperformed.
Bespoke provides Bespoke Premium and Bespoke Institutional members with a daily ETF Trends report that highlights proprietary trend and timing scores for more than 200 widely followed ETFs across all asset classes. If you’re an ETF investor, this daily report is perfect. Sign up below to access today’s ETF Trends report.
See Bespoke’s full daily ETF Trends report by starting a no-obligation free trial to our premium research. Click here to sign up with just your name and email address.
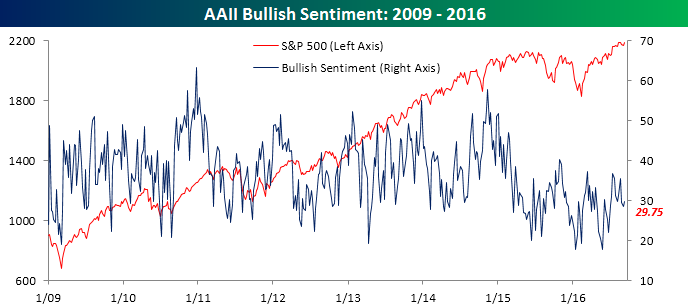
Still Little Joy in Investorville
Investors came back from the beach this week, but there still appears to be very little in the way of enthusiasm towards the equity market. In the latest sentiment survey from the American Association of Individual Investors (AAII), bullish sentiment increased from 28.6% up to 29.75%. An improvement? Yes. But when bullish sentiment is below 30%, it is generally a sign of pessimism. This week’s sub-30 reading also represents the 45th straight week where bullish sentiment was under 40%.
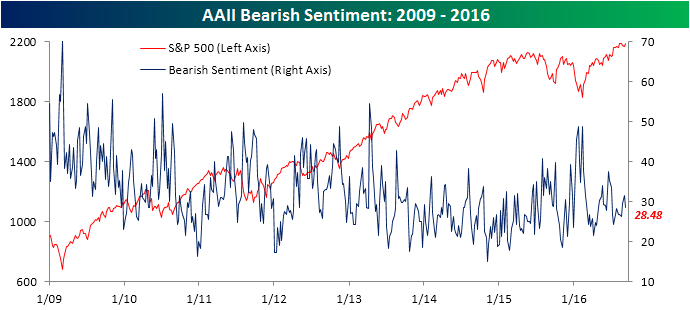
This week’s survey also showed that bearish sentiment declined from 31.52% down to 28.48%. With that decline, bearish sentiment is now once again lower than bullish sentiment for the first time in three weeks.
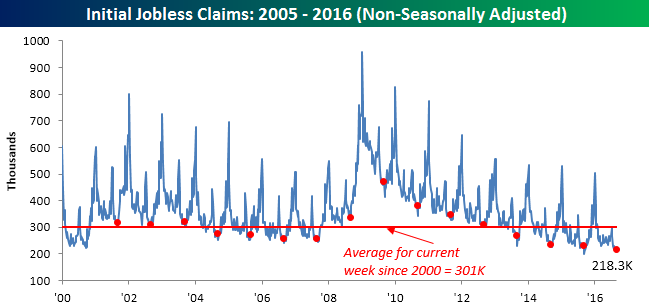
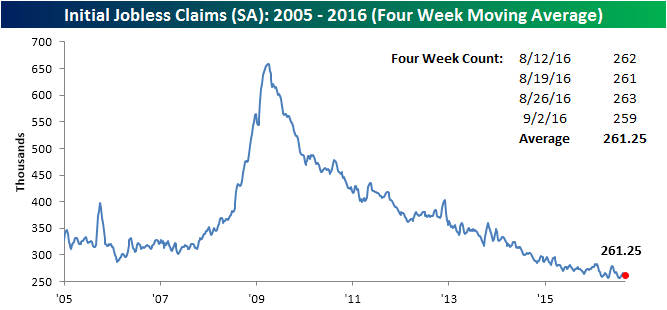
Jobless Claims Move Back Down Below 260K
Jobless claims for the latest week dropped back down below 260K for the first time since mid-July this week. While economists were forecasting first-time claims to rise by 2K to 265K (sixth straight week where expectations were 265K), the actual reading showed a decline of 4K to 259K. The big headline, however, is the fact that claims have now been below 300K for 79 straight weeks, and as we have repeatedly noted in prior weeks, that is the longest streak since 1970.

With this week’s decline, the four-week moving average in jobless claims fell to 261.25K from 263K last week. That puts the current level just over 5K above the multi-decade low of 256K that we saw 20 weeks ago back in April. It’s going to be hard to get back down to that level but you never know.
On a non-seasonally adjusted (NSA) basis, jobless claims increased by 3.2K up to 218.3K. That is more than 80K below the average for the current week of the year since 2000. In fact, to find a year where claims were lower for the current week of the year, you have to go all the way back to 1973.