The Closer 9/13/16 – 2015 Was A Banner Year
Looking for deeper insight on global markets and economics? In tonight’s Closer sent to Bespoke clients, we delve into the annual ASEC release from the US Census which details real median income growth, income distribution, poverty rates, and health insurance coverage data for US households. We also discuss the recovery in revenue for the US government in August.

The Closer is one of our most popular reports, and you can sign up for a trial below to see it and everything else Bespoke publishes free for the next two weeks!
Click here to start your no-obligation free Bespoke research trial now!
It’s the Most…Volatile Time…of the Year
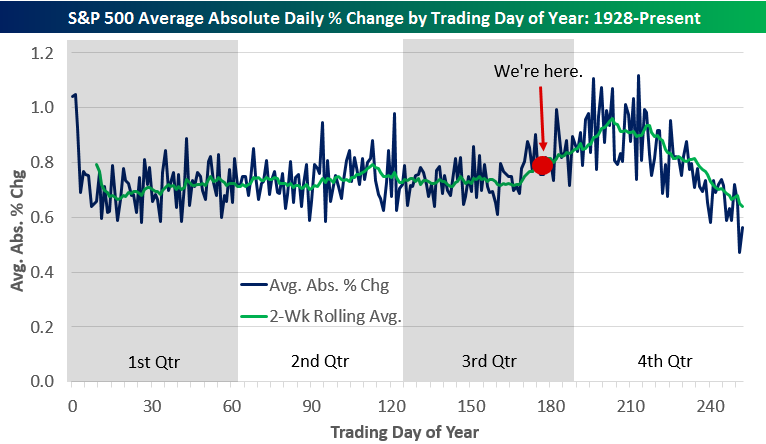
Prior to the Labor Day holiday, you could hear a pin drop on Wall Street as investors across the country (and world) took their final vacations of Summer 2016. Of course, here at Bespoke we never leave our desks (well maybe once every few years), and during those quiet days in late August, we made sure to take in the relative calm and tranquility in markets, because we knew that in a couple of weeks, things were likely to pick up again in a big way. The recent pick-up in volatility might be a shock to the system for some, but it’s completely normal based on seasonal patterns.
We calculated the average absolute change of the S&P 500 for each trading day of the year going back to 1928. (There are give or take 252 trading days each year.) Absolute change just means that down days are turned into up days so we can measure volatility. The average absolute daily change of a 2% up day and 4% down day would be +/-3%. Below is a chart showing the results from trading day 1 of the year through trading day 252. The blue line shows the average absolute percentage change for each trading day, while the green line is the rolling two-week average of the daily moves, which smooths things out quite a bit.
As shown, the first trading day of the year is usually very volatile with an average move of +/-1%, but then it dips down to a range of between 0.6% and 0.8% from pretty much the start of the year through late in the third quarter. Once September rolls around, we start to see a notable pick-up in daily volatility for the S&P 500. From early September through early November, volatility picks up more and more. The most volatile trading day of the year has historically been day 213, which is usually around November 1st or 2nd. From there, the market’s daily moves get smaller and smaller as we enter the holiday season, and things really die down around Christmas. The least volatile day of the year is actually the second to last day of the year (day 251), which has historically averaged a change of just +/-0.47%.
If you think the last few days have been volatile, buckle up, because the red dot in the chart below is where we are now — at trading day 176 of 2016.
NFIB Small Business Optimism Misses Expectations
Small business optimism for the month of August showed a modest decline and also missed expectations. While economists were expecting the headline index to increase from 94.6 up to 94.8, it actually declined down to 94.4. As shown in the chart below, small business optimism remains below its average of 96.0 going back to 2000 and is well off of its current cycle high of 100.3 back in December 2014.

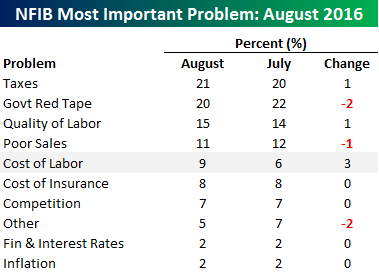 The table to the right breaks down which issues small businesses currently consider to be their biggest problems. As is the case each month, the two biggest problems are Taxes and Government Red Tape at 21% and 20%, respectively. Next on the list is Quality of Labor, which was cited by 15% of small businesses. Perhaps the most notable move this month, though, was Cost of Labor, which shot up from 6% up to 9%. As shown in the chart below, this is the highest reading for Cost of Labor in at least ten years. While inflation remains subdued and below the Fed’s target rate, if moves like the one we saw this month in the cost of labor keep up, you can expect overall inflation to follow suit.
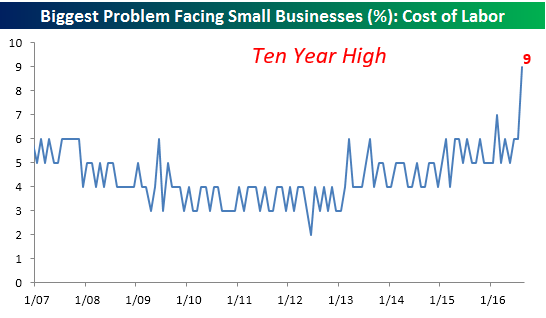
Chart of the Day: Asset Classes After Labor Day
Bespoke Stock Scores: 9/13/16
B.I.G. Tips – Investor Sentiment Check-Up
ETF Trends: US Indices & Styles – 9/13/16
Over the last week, only 10 ETFs we track were up as the selloff Friday continued on Tuesday. EM, equities, and fixed income all got hit over the last week, with the only significant positives in US markets being natural gas, oil, biotech, and the USD index.

Bespoke provides Bespoke Premium and Bespoke Institutional members with a daily ETF Trends report that highlights proprietary trend and timing scores for more than 200 widely followed ETFs across all asset classes. If you’re an ETF investor, this daily report is perfect. Sign up below to access today’s ETF Trends report.
See Bespoke’s full daily ETF Trends report by starting a no-obligation free trial to our premium research. Click here to sign up with just your name and email address.
Dynamic Upgrades/Downgrades: 9/12/16
The Closer 9/12/16 – Brainard Bucks Bond Bears
Looking for deeper insight on global markets and economics? In tonight’s Closer sent to Bespoke clients, we take a look at the drivers of recent selling in the Treasury market, including the composition of interest rates, positioning, and equity sector factors. We also give a complete recap of Governor Brainard’s speech from today, where she outlined the case of the FOMC’s doves, while also dabbling in some macro forecasting we agree with.
The Closer is one of our most popular reports, and you can sign up for a trial below to see it and everything else Bespoke publishes free for the next two weeks!
Click here to start your no-obligation free Bespoke research trial now!
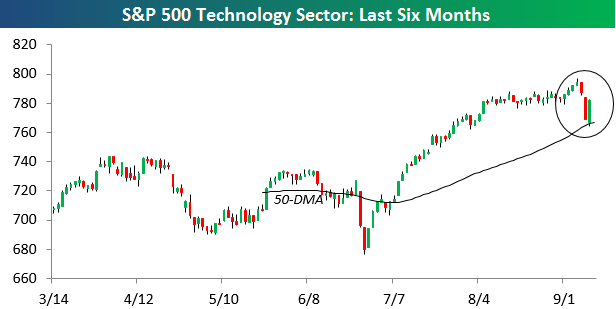
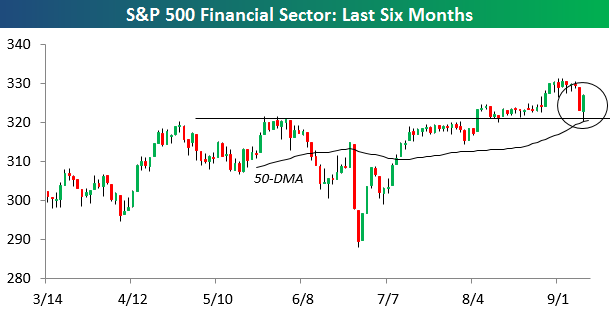
Tech and Financials Bounce Back
Equity markets bounced back in a big way today, and the two biggest sectors of the market — Technology and Financials — both tested and held key support at their 50-day moving averages. You can see the big moves over the past two trading days in the charts below: