Apple (AAPL) and Wynn (WYNN) Buck the Trend
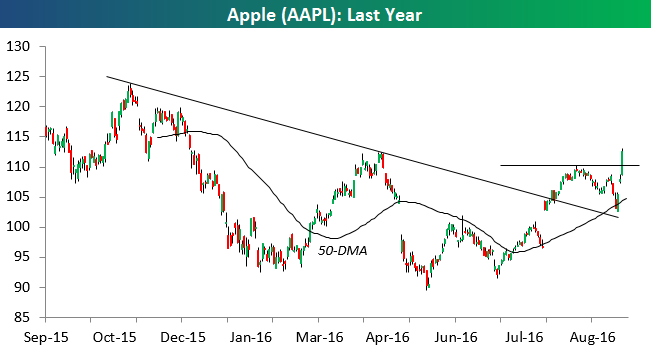
The S&P 500 is down 2.5% since the close last Thursday, but two widely followed stocks have really bucked the downtrend and traded nicely higher. The first is Apple (AAPL), which is up 6% since last Thursday and at its highest level in nine months. As shown below, the stock broke above the top of its downtrend channel a couple of months ago, and after holding support recently at its 50-day, it has shot higher over the last few days since the iPhone 7 release. Word is that the 7 is pretty awesome.
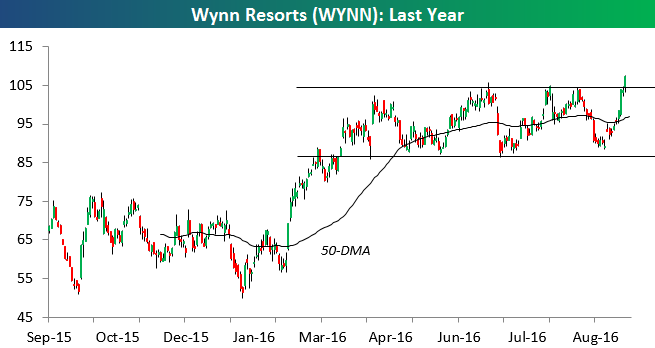
The second stock that has seen an even bigger move higher as the broad market has struggled recently is Wynn Resorts (WYNN). Since last Thursday’s close, WYNN is up 14%, and today we saw shares break to a new 52-week high. The stock had been trading in a sideways range for the past six months, but this move has caused a really nice breakout. Remember, WYNN is a stock that traded at near $250 back in March 2014.
Bespoke Short Interest Report: 9/14/16
ETF Trends: Hedge – 9/14/16
Only six ETFs we track are higher than they were a week ago, with floating rate bonds (insulated from interest rate shocks), EURUSD, T-bills, the USD, biotech, and natural gas the only financial assets in our universe of ETFs higher. Lower-duration bonds, MBS, bank loans, and the belly of the yield curve all held in pretty well, but declines were massive across global markets on a trailing five day basis. Commodities (especially steel companies), LatAm, REITs, Asia, and long-term Treasuries all got smoked over the last five days.

Bespoke provides Bespoke Premium and Bespoke Institutional members with a daily ETF Trends report that highlights proprietary trend and timing scores for more than 200 widely followed ETFs across all asset classes. If you’re an ETF investor, this daily report is perfect. Sign up below to access today’s ETF Trends report.
See Bespoke’s full daily ETF Trends report by starting a no-obligation free trial to our premium research. Click here to sign up with just your name and email address.
Fixed Income Weekly – 9/14/16
Searching for ways to better understand the fixed income space or looking for actionable ideals in this asset class? Bespoke’s Fixed Income Weekly provides an update on rates and credit every Wednesday. We start off with a fresh piece of analysis driven by what’s in the headlines or driving the market in a given week. We then provide charts of how US Treasury futures and rates are trading, before moving on to a summary of recent fixed income ETF performance, short-term interest rates including money market funds, and a trade idea. We summarize changes and recent developments for a variety of yield curves (UST, bund, Eurodollar, US breakeven inflation and Bespoke’s Global Yield Curve) before finishing with a review of recent UST yield curve changes, spread changes for major credit products and international bonds, and 1 year return profiles for a cross section of the fixed income world.
This week, we give our take on steepening yield curves, especially in the context of Fed forward guidance, which is an often-forgotten but still important part of the Fed’s policy toolkit.

Our Fixed Income Weekly helps investors stay on top of fixed income markets and gain new perspective on the developments in interest rates. You can sign up for a Bespoke research trial below to see this week’s report and everything else Bespoke publishes free for the next two weeks!
Click here to start your no-obligation free Bespoke research trial now!
B.I.G. Tips – Nasdaq 100 Stocks Holding Support
Crude Oil Inventories Don’t Reverse
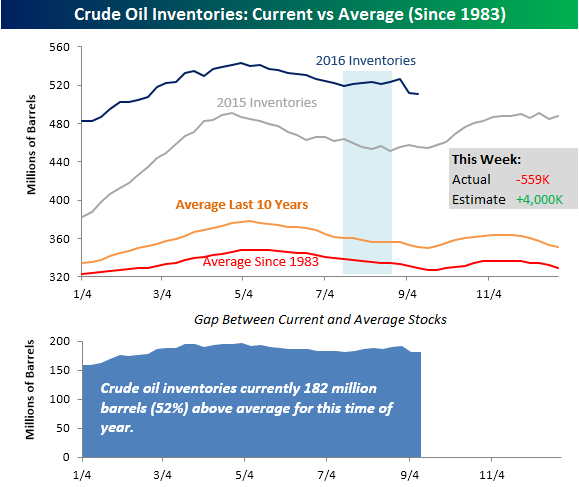
Crude oil inventories showed an unexpected decline even as traders were expecting last week’s monster drawdown to reverse itself partially. While traders were expecting crude stockpiles to increase by 4 million barrels, they actually declined by 559K. To put that in perspective, in the last two weeks traders have overestimated crude oil inventories by just under 20 million barrels! That’s a huge miss. In fact, it is the biggest overestimation over the course of a two week period since at least 2003. As shown in the chart below, crude oil inventories are now at their lowest levels since late February, which is pretty close to the seasonal pattern for this time of year. What is different this year, however, is that stockpiles are still more than 50% above their historical average for this time of year.
While crude oil inventories saw a modest decline, gasoline inventories saw a modest build. While traders were expecting stockpiles to drop by 1.1 million barrels, they actually declined by just a bit more than half a million barrels. Like crude oil, gasoline stockpiles are above average but not by nearly as extreme of an amount. As shown in the chart below, inventories have been following the season pattern very closely.
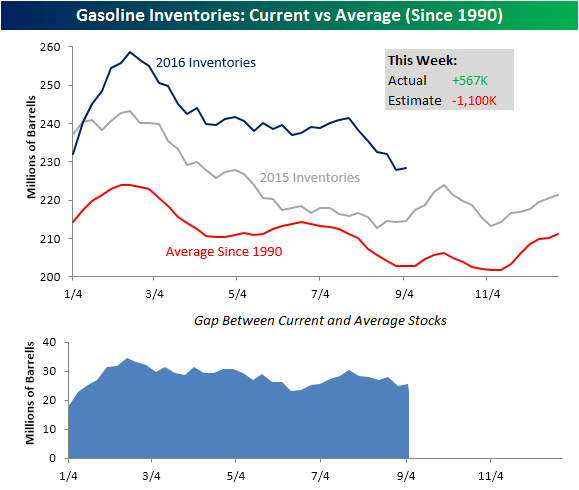
Chart of the Day: Down, Up, Down…
Dynamic Upgrades/Downgrades: 9/14/16
The Closer 9/13/16 – 2015 Was A Banner Year
Looking for deeper insight on global markets and economics? In tonight’s Closer sent to Bespoke clients, we delve into the annual ASEC release from the US Census which details real median income growth, income distribution, poverty rates, and health insurance coverage data for US households. We also discuss the recovery in revenue for the US government in August.
The Closer is one of our most popular reports, and you can sign up for a trial below to see it and everything else Bespoke publishes free for the next two weeks!
Click here to start your no-obligation free Bespoke research trial now!
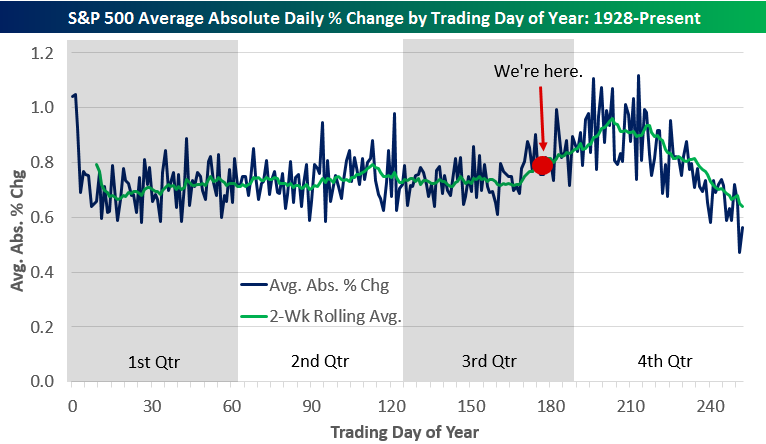
It’s the Most…Volatile Time…of the Year
Prior to the Labor Day holiday, you could hear a pin drop on Wall Street as investors across the country (and world) took their final vacations of Summer 2016. Of course, here at Bespoke we never leave our desks (well maybe once every few years), and during those quiet days in late August, we made sure to take in the relative calm and tranquility in markets, because we knew that in a couple of weeks, things were likely to pick up again in a big way. The recent pick-up in volatility might be a shock to the system for some, but it’s completely normal based on seasonal patterns.
We calculated the average absolute change of the S&P 500 for each trading day of the year going back to 1928. (There are give or take 252 trading days each year.) Absolute change just means that down days are turned into up days so we can measure volatility. The average absolute daily change of a 2% up day and 4% down day would be +/-3%. Below is a chart showing the results from trading day 1 of the year through trading day 252. The blue line shows the average absolute percentage change for each trading day, while the green line is the rolling two-week average of the daily moves, which smooths things out quite a bit.
As shown, the first trading day of the year is usually very volatile with an average move of +/-1%, but then it dips down to a range of between 0.6% and 0.8% from pretty much the start of the year through late in the third quarter. Once September rolls around, we start to see a notable pick-up in daily volatility for the S&P 500. From early September through early November, volatility picks up more and more. The most volatile trading day of the year has historically been day 213, which is usually around November 1st or 2nd. From there, the market’s daily moves get smaller and smaller as we enter the holiday season, and things really die down around Christmas. The least volatile day of the year is actually the second to last day of the year (day 251), which has historically averaged a change of just +/-0.47%.
If you think the last few days have been volatile, buckle up, because the red dot in the chart below is where we are now — at trading day 176 of 2016.