The Closer 9/16/16 – End of Week Charts
Looking for deeper insight on global markets and economics? In tonight’s Closer sent to Bespoke clients, we recap weekly price action in major asset classes, update economic surprise index data for major economies, chart the weekly Commitment of Traders report from the CFTC, and provide our normal nightly update on ETF performance, volume and price movers, and the Bespoke Market Timing Model.

The Closer is one of our most popular reports, and you can sign up for a trial below to see it and everything else Bespoke publishes free for the next two weeks!
Click here to start your no-obligation free Bespoke research trial now!
The BESPOKE REPORT Newsletter — 9/16/16
Bespoke’s Quick-View Chart Book: 9/16/16
ETF Trends: International – 9/16/16
After a couple days with negative returns on the “Best Performers” list, it’s all green in the top 20 ETF performers we track in the table below. Biotech and Natural Gas continue to perform well, while semiconductors have also outperformed following a big forecast upgrade from Intel today. Tech in general has been doing very well too. On the worst-performers list, Mexican equities and the peso are being used as something of a proxy for Trump’s Presidential victory chances, while oil has suffered mightily over the last few weeks. Italy, Spain, and New Zealand join Mexico on the underperformance list.

Bespoke provides Bespoke Premium and Bespoke Institutional members with a daily ETF Trends report that highlights proprietary trend and timing scores for more than 200 widely followed ETFs across all asset classes. If you’re an ETF investor, this daily report is perfect. Sign up below to access today’s ETF Trends report.
See Bespoke’s full daily ETF Trends report by starting a no-obligation free trial to our premium research. Click here to sign up with just your name and email address.
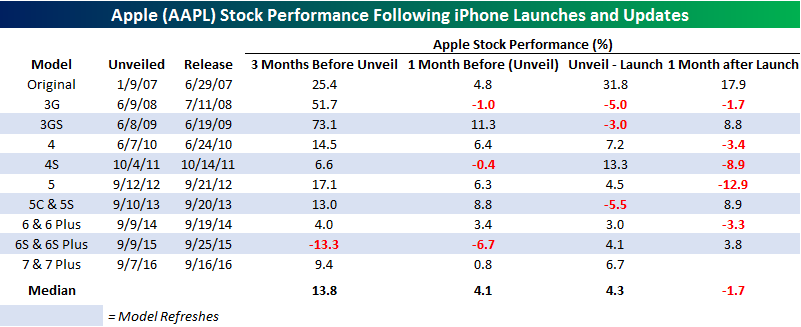
Apple Performance Around iPhone Launches
As mentioned earlier, Apple (AAPL) has had quite a week on optimism regarding sales of the new iPhone 7 and 7 Plus. Through yesterday’s close, the stock was up 6.7% since the unveiling of the new model on 9/7. As shown in the table below, that ranks as the best performance for the stock from an unveil to launch of a new iPhone model since the 13.3% rally back in 2011 when Apple introduced the 4S. If you don’t remember, the 4S was the first model that included Siri, which at the time was considered a pretty big deal. A big difference between AAPL’s performance now and back in 2011 after the 4S was launched is that back then AAPL’s rally occurred in the midst of a 9% rally for the S&P 500. In the current period, the S&P 500 is actually down nearly 2%. Looking forward, the table below also includes the performance of AAPL’s stock in the one-month period following the launch of new iPhone models. Overall, the stock has seen a median decline of 1.7% with positive returns in four out of nine periods.
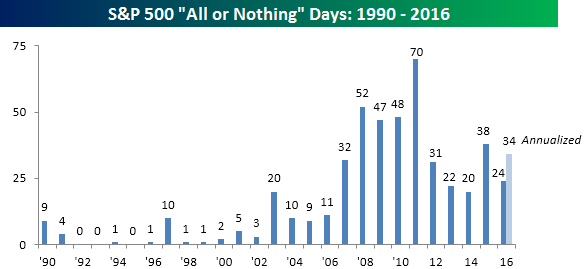
“All or Nothing Days” on the Rise
After a long summer slumber, volatility has worked its way back into the equity market with gusto over the last week. Through yesterday’s close, the S&P 500 had seen four what we call “all or nothing days” in the prior five trading days, and that came after a 43 trading day stretch with no occurrences. An “all or nothing day” represents a day where the S&P 500’s net daily A/D (advance/decline) reading is greater than +/-400. The last time we saw four all or nothing days over a five trading day period was back in June during the aftermath of the Brexit vote.
The chart below shows the number of all or nothing days for the S&P 500 by year going back to 1990. With the recent spurt of occurrences, this year’s total is now up to 24, putting 2016 on pace for 34. Relative to history, this would rank as the sixth most for a given year since 1990, but slightly below last year’s total of 38. What really stands out about the chart below is how the frequency of all or nothing days has surged over the last decade. The reason for that can be summed up with three letters – ETF. As ETFs have become ubiquitous in the last several years, the equity market has become increasingly all or nothing (hence the name of the days). Rather than buying or selling individual names when looking to gain or lose exposure to the market, investors/traders increasingly just buy or sell ETFs, thereby impacting an entire basket of stocks rather than just one individual name. While there’s no denying the utility that ETFs provide in their ability to quickly add exposure to a broad asset class or sector, as with any new development, there are always side effects, and one of those is the fact that the market has become increasingly one-sided on a day to day basis.
Apple (AAPL) Market Cap Back Above $600 Billion
Apple (AAPL) ended last week with a market cap of $555 billion, which was just $25 billion larger than the second largest company in the world — Alphabet (GOOGL). With a gain of 12% this week, Apple’s market cap ballooned by $67 billion up to $622 billion, which now makes it the largest company in the S&P 500 by $83 billion.
To put things into perspective, Apple’s gain of $67 billion in market cap this week is larger than the market caps of 439 stocks (roughly 87%) in the S&P 500. Apple’s increase in market cap in just one week is the equivalent of adding an entire Costco (COST), or Biogen (BIIB), or Broadcom (BRCM), which all have market caps of roughly $67 billion. It’s the equivalent of adding two Yum! Brands (YUM), or NVIDIAs (NVDA), or Travelers (TRV), which all have market caps that are roughly half the size of Apple’s gain in market cap this week. Travelers (TRV) is another Dow 30 stock, mind you, that has an equal weighting with Apple in the Dow because their share prices are both right near $115. Apple also gained more in market cap this week than the combined market caps of the smallest 354 companies in the Russell 2,000. So yeah, Apple’s gain this week is a pretty big deal for the market.
Below is a chart showing the market caps of the three largest companies in the S&P — Apple, Alphabet and Microsoft. Prior to its declines that began in mid-2015, Apple had a huge market cap lead on GOOGL and MSFT, but the lead had tightened significantly by early 2016. Let’s see if Apple can continue to create space here now that it has broken out the 16-month downtrend that it was in.

The Closer 9/15/16 – Data Deluge
Looking for deeper insight on global markets and economics? In tonight’s Closer sent to Bespoke clients, we recap the huge number of data releases that hit the tape today including the current account balance, PPI, the Philly Fed Business Activity Index, and Industrial Production.
The Closer is one of our most popular reports, and you can sign up for a trial below to see it and everything else Bespoke publishes free for the next two weeks!
Click here to start your no-obligation free Bespoke research trial now!
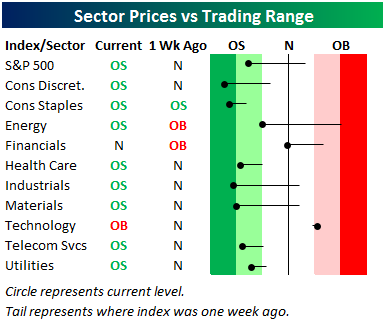
Bespoke’s Sector Snapshot — 9/15/16
We’ve just released our weekly Sector Snapshot report (see a sample here) for Bespoke Premium and Bespoke Institutional members. Please log-in here to view the report if you’re already a member. If you’re not yet a subscriber and would like to see the report, please start a 14-day trial to Bespoke Premium now.
Below is one of the many charts included in this week’s Sector Snapshot, which is our trading range screen for the S&P 500 and its ten sectors. We discuss in more detail how to read the chart in the full version of the report, but basically the dot is where the sector is currently trading, while the tail end is where it was trading one week ago. As shown, even with today’s rally, the S&P 500 and eight of ten sectors are in oversold territory. The only sector that has held up well over the last week is Technology, and that has been driven by Apple’s (AAPL) post-iPhone 7 surge.
To see our full Sector Snapshot with additional commentary plus six pages of charts that include analysis of valuations, breadth, technicals, and relative strength, start a 14-day free trial to our Bespoke Premium package now. Here’s a breakdown of the products you’ll receive.